The Bitcoin price began the month of September with a gradual increase. However, on September 24, a rapid downward move ensued. This flash crash was present throughout the cryptocurrency market. However, most alternate coins (altcoins) have rebounded better than Bitcoin.
In this article, we are going to analyze the top five altcoin performers in the month of September. They are chosen out of the top 15 digital currencies ranked by market cap, so smaller altcoins which might have had massive increases are excluded from the list.
The highest risers are given in the table below.
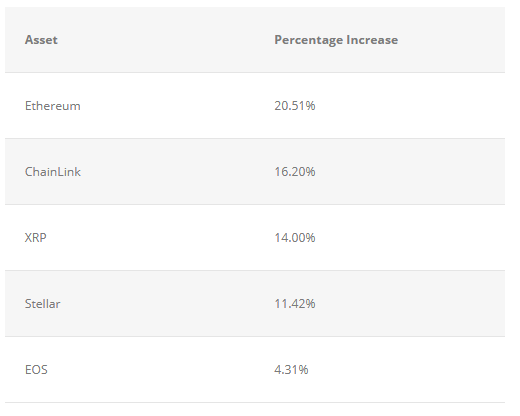
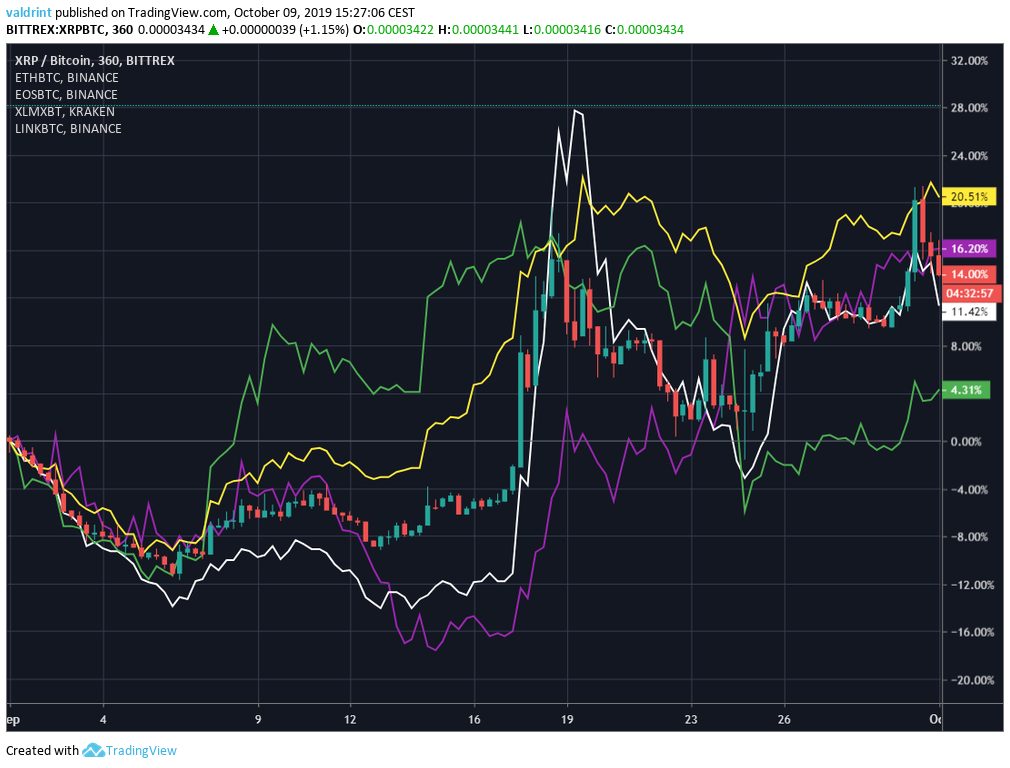
Additionally, the exact altcoin price movements are given in the image below.
ETH/BTC September Performance
In the image presented in the introduction, the price movement of Ethereum is represented by the yellow line.
The Ethereum price began to increase on September 6, before reaching a high on September 20. Also, ETH handled the September 24 crash very well — rebounding after only three days.
One reason for the 20 percent increase in the price could have been investors’ future expectations following the announced hard fork. While the fork was expected to be launched on October 13, it was delayed to October 30. The main change resulting from it is the switch from Proof-Of-Work to a programmatic POW. This is aimed to level the playing field when it comes to using different GPUs for mining the coin for decentralized applications.
ETH/BTC October Prediction
Looking at the weekly chart, we can see that Ethereum has been trading inside a descending wedge since September of 2018.
We do not expect ETH to break out in October.
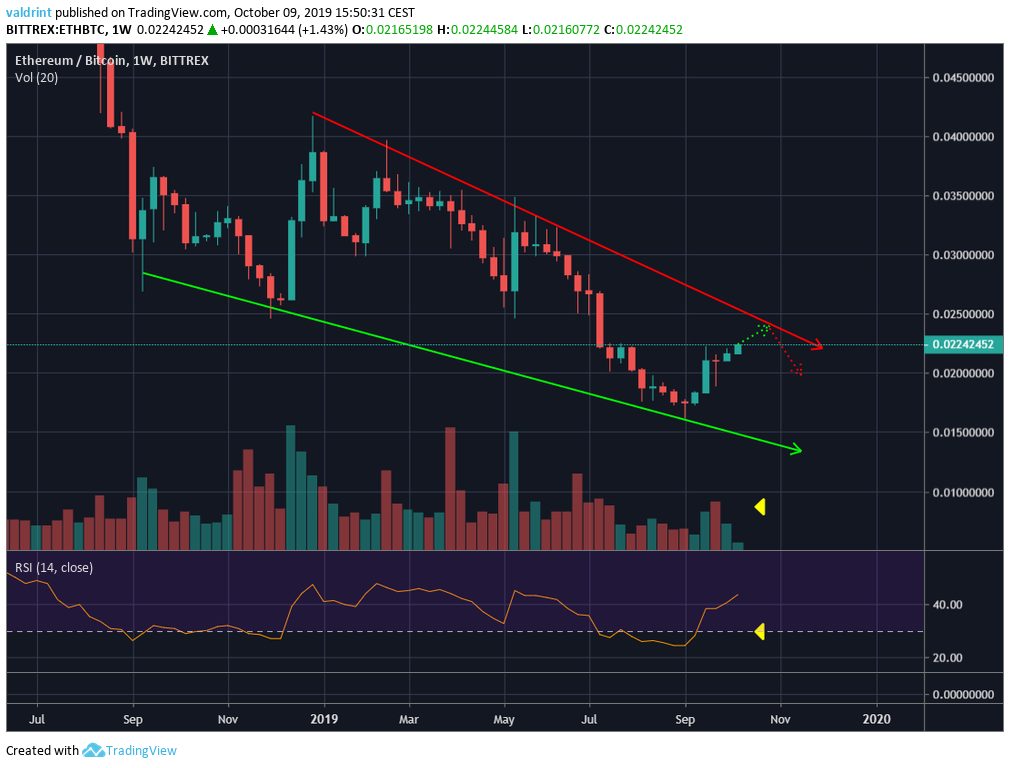
The main reason for this is the low volume in the current upward move.
In order for the Ethereum price to move out of a pattern it has been trading for more than a year, much higher volume will be required.
Additionally, while the RSI has moved away from its oversold territory, it seems to have stalled around 40.
Furthermore, there is no bullish divergence.
Throughout October, we expect the price to be rejected by the resistance line before decreasing to around ₿0.020 — where it is likely to finish the month.
LINK/BTC September Performance
In the image presented in the introduction, ChainLink (LINK) is represented by the purple line.
Unlike the other coins analyzed, the price of the LINK token decreased until September 16. It has been increasing since — completely neglecting the September 24 flash crash was nonexistent.
One of the main reasons for the September increase have been that the network is growing significantly and the number of large transactions has more than doubled.
We discussed these and other possible reasons in more detail here.
LINK/BTC October Prediction
The LINK price reached a high of nearly ₿0.0004 in the beginning of July.
The September increase caused it to break out above the descending resistance line and head for the July highs.
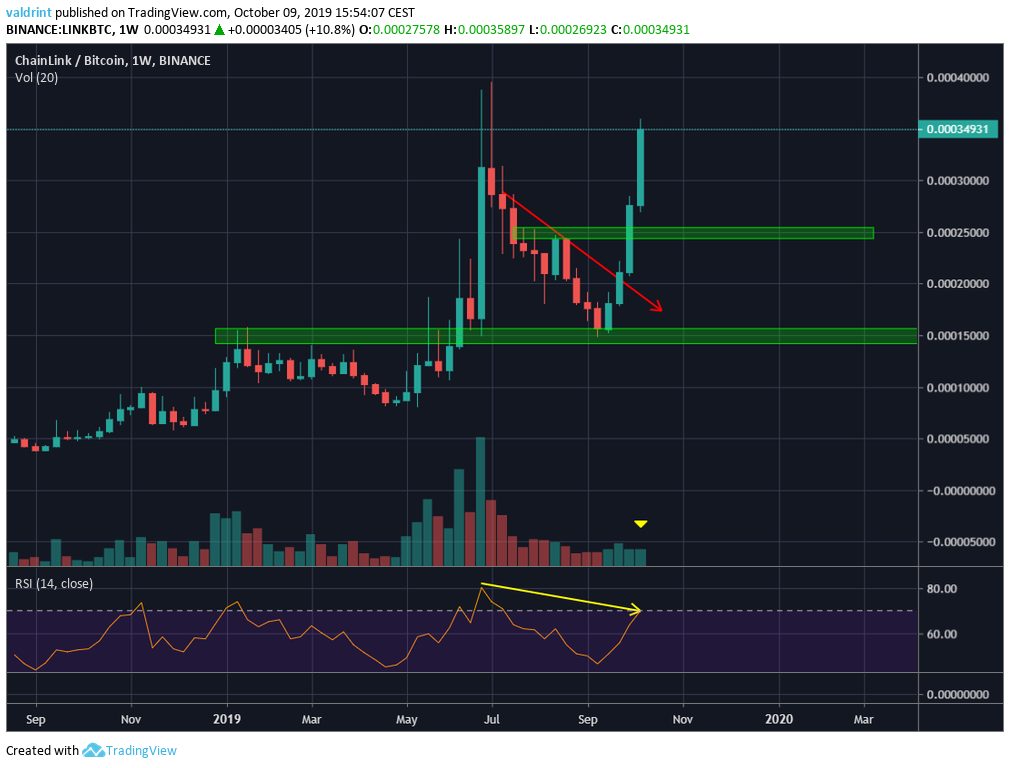
However, trading volume on the recent movement has been extremely weak. Additionally, we have developing bearish divergence in the RSI.
This makes us believe that LINK will not reach a higher high. Rather, it is likely to decrease towards the support area at ₿0.000250 and possibly fall to ₿0.000150.
XRP/BTC September Performance
In the image presented in the introduction, XRP is represented by candlesticks.
XRP began to increase on September 4 and reached a high on September 18. Afterward, it began a decrease which culminated with the September 24 flash crash.
XRP has been increasing since and the price at the end of September was the highest recorded in the month.
One of the reasons for the increase of XRP, especially towards the end of the month, could have been the acquisition of the tech company Algrim.
Additionally, the Swell conference, which is considered the biggest XRP conference of the year, is set to be held in November 2019.
Last year, the rate of increase for XRP similarly accelerated in the months preceding the conference.
XRP/BTC October Prediction
In the weekly time-frame, XRP has just moved above the 10- and 20-week moving averages — which have started to turn upward, possibly setting up for a bullish cross.
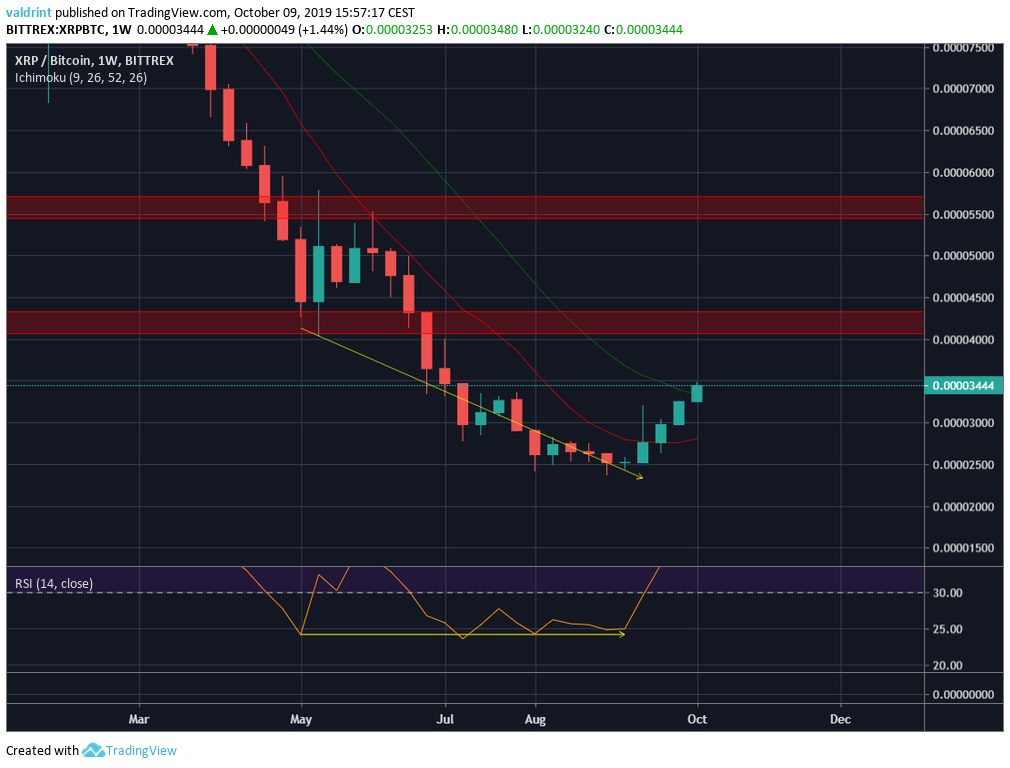
Additionally, this move was preceded by bullish divergence in the RSI.
For the rest of October, we expect the XRP price to move towards the resistance areas.
We expect a price between ₿0.0004-₿0.0005 at the end of the month.
XLM/BTC September Performance
In the image presented in the introduction, XLM is represented by the white line.
The price movement was very similar to that of XRP and ETH. However, the September 19 high was the highest reached from the coins we analyzed — but the September 24 crash was steeper for the lumen (XLM) and the ensuing rebound weaker.
The increased performance in the middle of the month can be attributed to the Binance announcement of an airdrop in early September, which may have helped bolster the Stellar network.
Binance distributed 9,500,000 XLM to everyone with at least 10 XLM in their Binance exchange wallets
XLM/BTC October Prediction
The Stellar Lumens price has recently broke out from a descending resistance line and moved above its 100-day moving average.
It is approaching the resistance area outlined below.
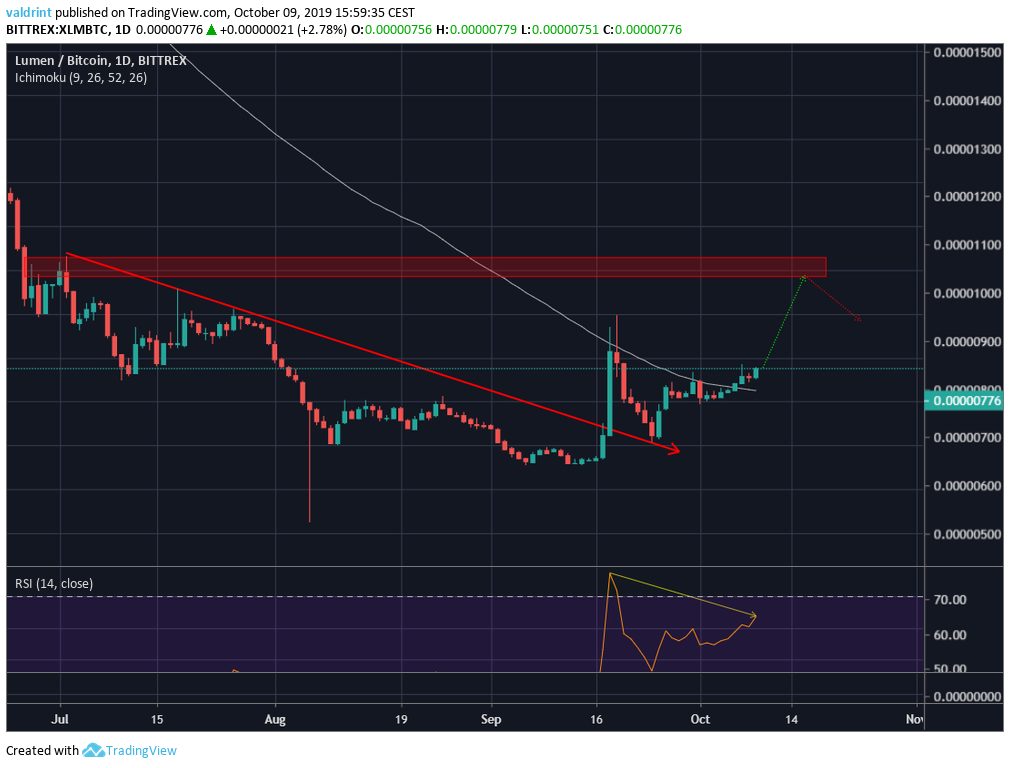
However, there is some bearish divergence developing in the RSI.
This makes us believe that the Stellar Lumens price will not break out above the resistance area.
We expect the XLM price to reach it and decrease slightly — finishing the month at around ₿0.00000950.
EOS/BTC September Performance
In the graph presented in the introduction, the price movement for EOS — an Ethereum competitor for smart contracts — is represented by the green line.
EOS increased gradually until September 19, before beginning a gradual downtrend.
After the September 24 flash crash, the rebound was extremely weak — causing EOS to lag behind the other coins.
The September performance could have been tied to the announcement by Monster bytes that they will create a token for the internet gambling industry in the EOS platform.
The initial exchange offering was made on September 16 and preceded the high reached on September 19.
EOS/BTC October Prediction
Looking at the daily chart we can see that EOS has been following an ascending support line since the beginning of September.
Additionally, the 10- and 20-day moving averages have just made a bullish cross.
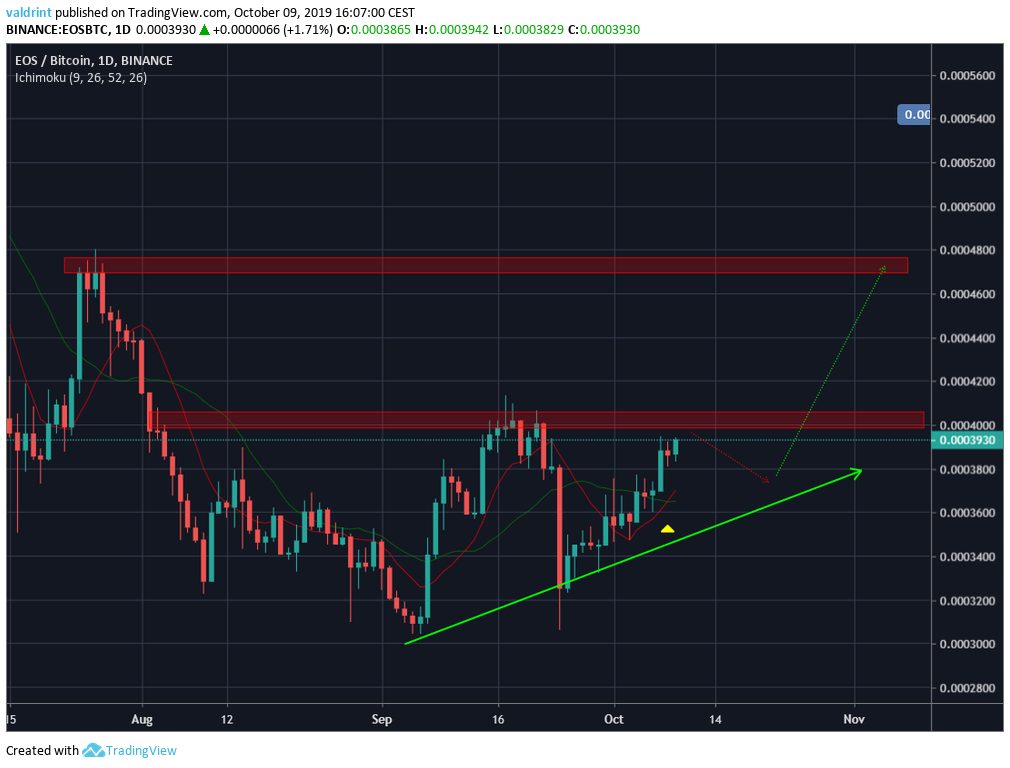
This makes us believe that EOS will eventually break out above the first resistance area and head for the second one.
For the end of October, we expect a price of around ₿0.00044 for the digital asset — which may or may not be in line with other EOS price predictions.
Summary
A table with our predictions for the month of September is given below.
