The pending home sales index for September was released by the National Association of Realtors (NAR) yesterday, and our analysis suggests that October existing home sales could be very bad.
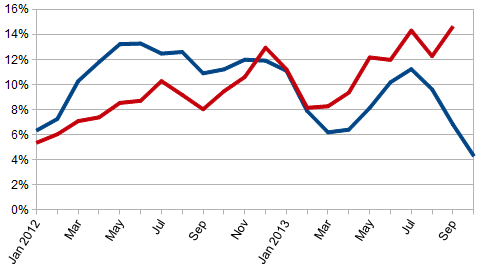
- The current trend (using 3 month rolling averages) continues to show a growing deceleration in pending home sales.
- Extrapolating this data to project October existing home sales, this would be a 5.3% contraction year-over-year in September existing home sales.
- Pending home sales are based on contract signings, and existing home sales are based on the execution of the contract (contract closing).
- After 28 months of year-over-year growth, pending home sales according to the adjusted data contracted this month.
The NAR reported the September pending home sales index down 5.6% month-over-month and down 1.2% year-over-year. The market was expecting contraction of 1.3% to 2.0% (versus the contraction of 5.6% reported). Econintersect‘s evaluation shows the index growth decelerated 1.7% month-over-month and up 1.1% year-over-year.
Unadjusted 3 Month Rolling Average of Year-over-Year Growth for Pending Home Sales (blue line) and Existing Home Sales (red line)
From Lawrence Yun , NAR chief economist:
Pending home sales declined for the fourth consecutive month in September, as higher mortgage interest rates and higher home prices curbed buying power, according to the National Association of Realtors®.
The Pending Home Sales Index,* a forward-looking indicator based on contract signings, fell 5.6 percent to 101.6 in September from a downwardly revised 107.6 in August, and is 1.2 percent below September 2012 when it was 102.8. The index is at the lowest level since December 2012 when it was 101.3; the data reflect contracts but not closings.
Lawrence Yun, NAR chief economist, said concerns over the government shutdown also played a role. “Declining housing affordability conditions are likely responsible for the bulk of reduced contract activity,” he said. “In addition, government and contract workers were on the sidelines with growing insecurity over lawmakers’ inability to agree on a budget. A broader hit on consumer confidence from general uncertainty also curbs major expenditures such as home purchases.”
Yun notes this is the first time in 29 months that pending home sales weren’t above year-ago levels. “This tells us to expect lower home sales for the fourth quarter, with a flat trend going into 2014. Even so, ongoing inventory shortages will continue to lift home prices, though at a slower single-digit growth rate next year.”
The National Association of Realtors (NAR) pending home sales index offers a window into predicting existing home sales. The actual home sale might appear in the month the contract was signed (cash buyers account for 32% of home sales in August according to the NAR), or in the following two months.
Econintersect evaluates by offsetting the index one month to project unadjusted existing home sales. Using this index offset one month suggests unadjusted existing home sales of 380,000 in September 2013 (positive 35,000 fudge factor this month for historical error using this methodology for the month of Septembers in years past).
Using Pending Home Sales to Predict Existing Homes Sales – Unadjusted Existing Home Sales (blue line) and Predictive Forecast Using Pending Home Sales Index (red line)
Using this methodology, 410,000 (negative 30,000 fudge factor) existing home unadjusted sales were forecast for September 2013 sales vs the actual reported number of 428,000 (which is subject to further revision).
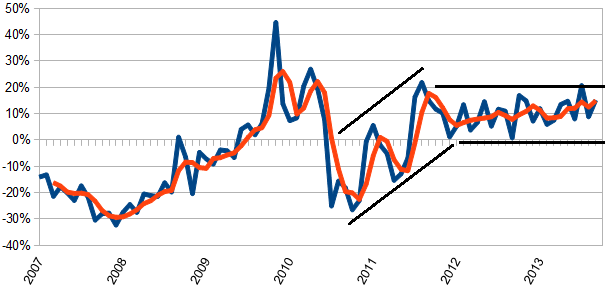
Unadjusted Year-over-Year Change in Existing Home Sales Volumes
As shown on the above graphic, since mid 2011, home sales have been positively growing year-over-year. However, the strong rate of growth seen since mid-2010 appears to have moderated to a lower growth channel as shown on the graph above.
Keeping things real – home sales volumes are only 2/3rds of previous levels.
Caveats on the Use of Pending Home Sales Index
According to the NAR:
NAR’s Pending Home Sales Index (PHSI) is released during the first week of each month. It is designed to be a leading indicator of housing activity.
The index measures housing contract activity. It is based on signed real estate contracts for existing single-family homes, condos and co-ops. A signed contract is not counted as a sale until the transaction closes. Modeling for the PHSI looks at the monthly relationship between existing-home sale contracts and transaction closings over the last four years.
…… When a seller accepts a sales contract on a property, it is recorded into a Multiple Listing Service (MLS) as a “pending home sale.” The majority of pending home sales become home sale transactions, typically one to two months later.
NAR now collects pending home sales data from MLSs and large brokers. Altogether, we receive data from over 100 MLSs & 60 large brokers, giving us a large sample size covering 50% of the EHS sample. This is equal to 20 percent of all transactions.
In other words, Pending Home Sales is an extrapolation of a sample equal to 20% of the whole. Econintersect uses Pending Home Index to forecast future existing home sales.
Econintersect reset the forecasting of existing home sales using the pending home sales index coincident with November 2011 Pending home sales analysis (see here) – as the NAR in November revised the historical existing home sales data.
The Econintersect forecasting methodology is influenced by the speed at which closings occur. When they slow down in a particular period – this method overestimates. The number of cash buyers are speeding up the process (cash buyers analysis here). A quick cash home sale process could begin and end in the same month. On the other hand, contracts for short sales can sometimes take months to close. Interpreting the pending home sales data is complicated by weighing offsetting effects in the current abnormal market.
Please note that Econintersect uses unadjusted data in its analysis.
Econintersect determines the month-over-month change by subtracting the current month’s year-over-year change from the previous month’s year-over-year change. This is the best of the bad options available to determine month-over-month trends – as the preferred methodology would be to use multi-year data (but the New Normal effects and the Great Recession distort historical data).


