
Equities
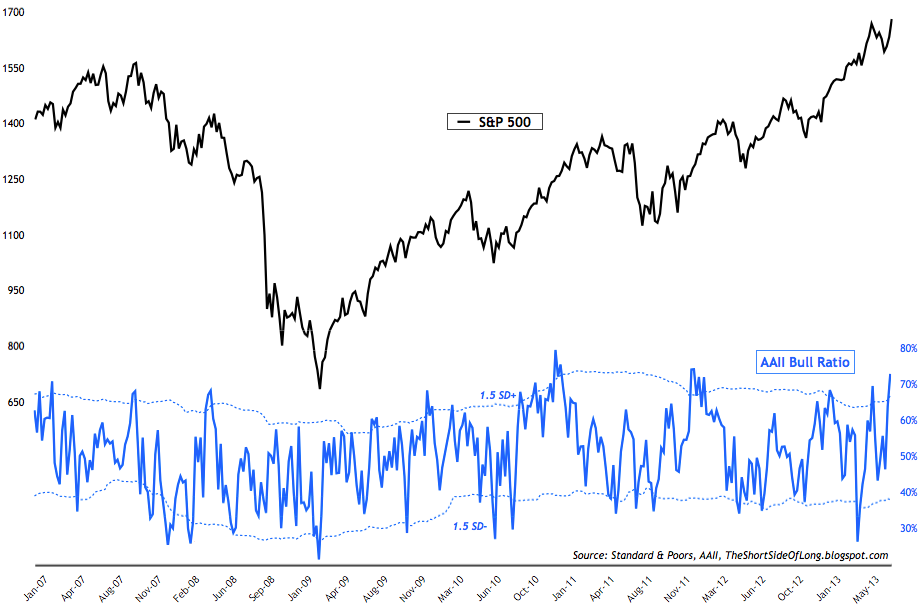
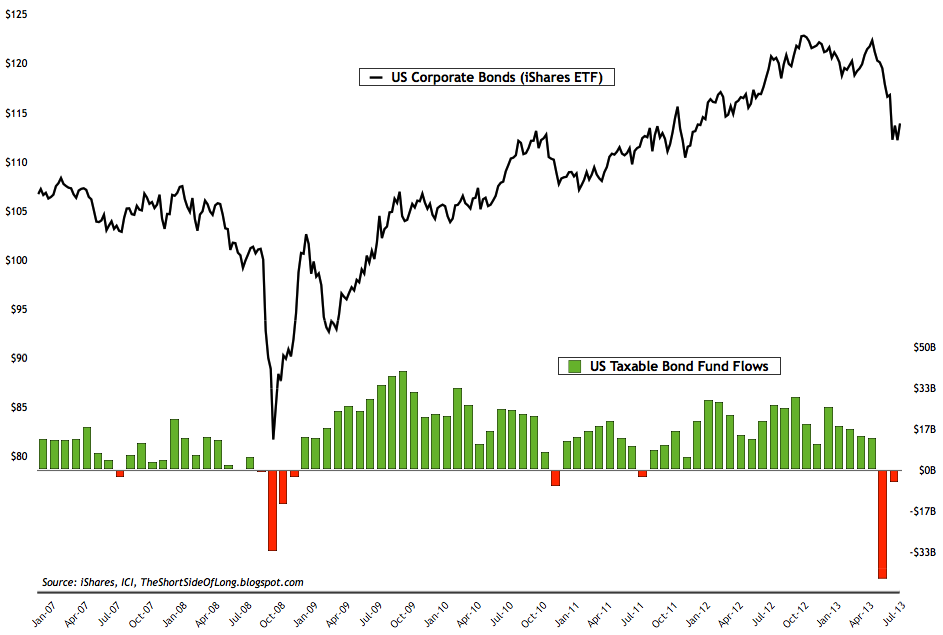
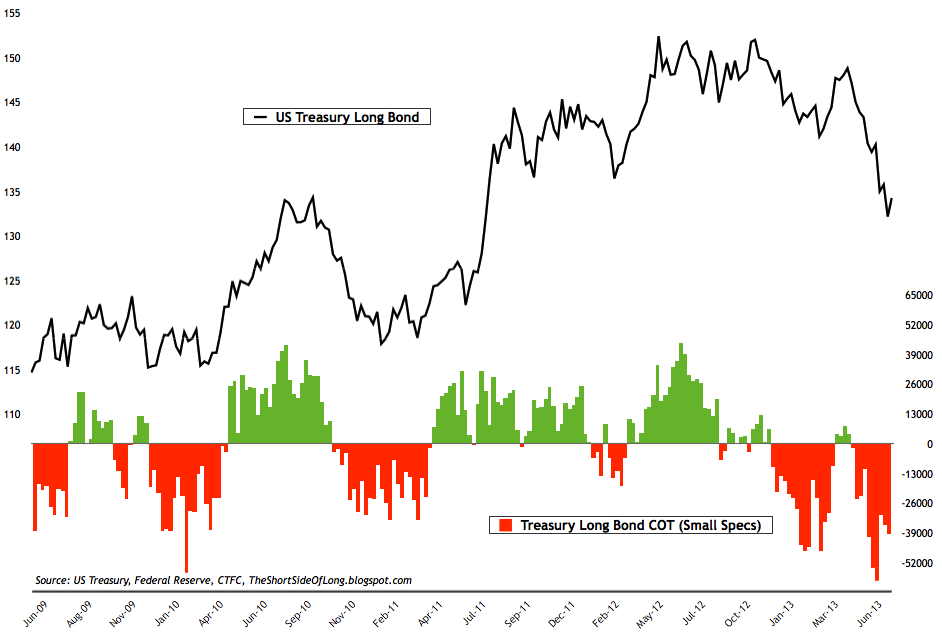
Chart 4: Funds continue to dramatically cut their commodity exposure
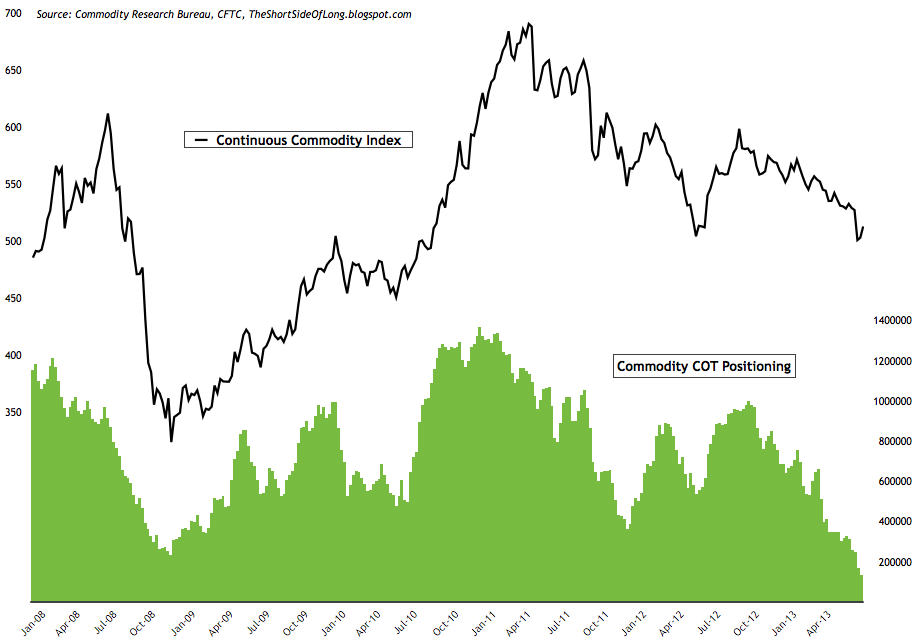
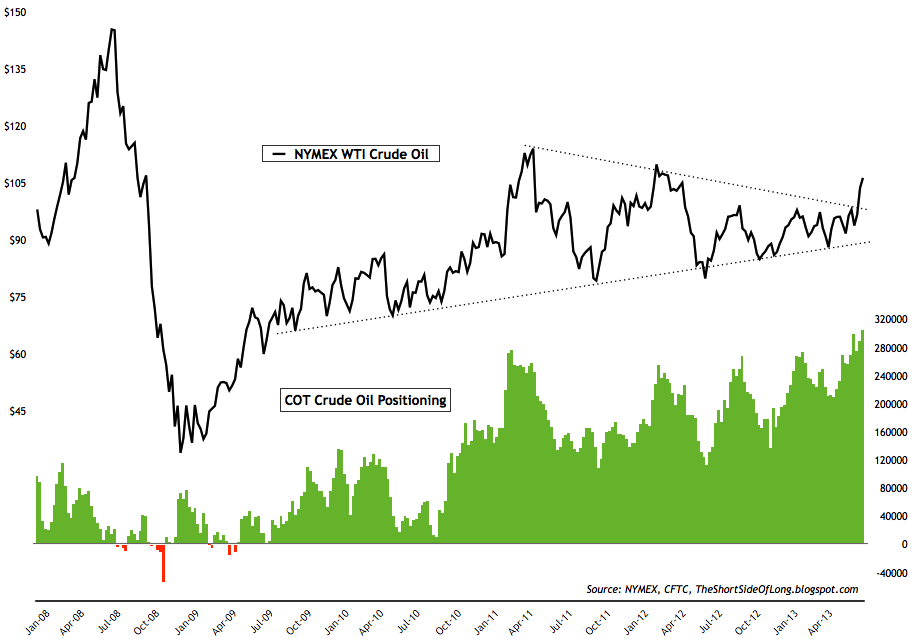
Chart 6: Hedge funds are building bullish greenback bets again
- Quite a lot of price movements in the last week or two, with US equities moving towards new highs, Crude Oil break out of its two year consolidation and precious metals rebounding from their three year lows. Lets get into this weeks sentiment update:
- AAII survey readings came in at 49% bulls and 18% bears. Bullish readings rose by 7% while bearish readings fell by 5.5%. The AAII bull ratio currently stands at 73%, which indicates extreme optimism amongst the retail investment community. I believe we are currently in a top building formation and this is now the second time AAII survey has signal readings 1.5 SD+ above the mean (chart above). For referencing, AAII bull ratio survey chart can been seen by clicking here, while AAII Cash Allocation survey chart can be seen by clicking clicking here.
- Investor Intelligence survey levels came in at 47% bulls and 23% bears. Bullish readings rose by 3%, while bearish readings also rose by 2%. II bull ratio has fallen only slightly from the previous weeks reading and it currently stands at 67%. For referencing, recent chart of the II bull ratio chart can be seen by clicking clicking here.
- NAAIM survey levels came in at 47% net long exposure, while the intensity rose slightly towards 75%. Please remember that in early parts of this year, this sentiment indicator reached a record high levels. With a recent price correction, the reading has mean reverted somewhat, however we are no where near a panic. In other words, the buy signal is still a long way away. For referencing, recent NAAIM survey chart can be seen by clicking clicking here.
- Other sentiment surveys have also started to pull back from recent extremely bullish readings seen through the month of May and June. Consensus Inc survey has reverted back towards the mean now, while Market Vane survey still remains closer to the optimistic extremes seen over the last few months. No indicator has approached a worthy contrarian "buy signals" just yet. For referencing, recent Hulbert Newsletter Sentiment survey chart can be seen by clicking clicking here.
- This weeks ICI fund flows report showed "equity funds had estimated inflows of $228 million for the week, compared to estimated inflows of $45 million in the previous week. Domestic equity funds had estimated outflows of $2.08 billion, while estimated inflows to world equity funds were $2.31 billion." As already discussed last week, the evidence still points to retail investor optimism when it comes to global equity fund flows. Rydex fund flows have pulled even further from previous weeks readings. The Nova Ursa fund flow indicator has fallen to a ratio of lower then 25 from the ratio of 45. Nevertheless, a long term buy signal is by and large a long way away, as Nova Ursa ratio would have to drop as low as 10 (like in March 2009, July 2010 and October 2011). For referencing, recent Rydex fund flow chart can be seen by clicking clicking here.
- Last weeks commitment of traders report showed that hedge funds and other speculators increased their bets from the previous week. Net long positions held on the US tech equities has risen to 67,000 bets from low 50,000s last week. We are not yet reaching extreme on either end of the scale. For referencing, recent Nasdaq COT chart can be seen by clicking clicking here.
- Bond sentiment surveys are nearing pessimistic territory as already discussed last week. Market Vane survey and Hulbert Newsletter Bond survey are turning more negative but are not yet at the panic levels, while Consensus Inc survey has now reached extreme downside levels with only 24% bulls. While this is now a buy signal, investors should take note that this gauge dropped as low as 20% bulls during the February 2011 low in bonds. In other words, another week or two of strong selling and bonds could be near an intermeidate low.
- This weeks ICI fund flows report showed "bond funds had estimated outflows of $5.97 billion, compared to estimated outflows of $28.23 billion during the previous week. Taxable bond funds saw estimated outflows of $5.05 billion, while municipal bond funds had estimated outflows of $920 million." Retail investors continue to panic sell out of the bond market. All debt maturity and all grades have been affected by the recent price volatility. The chart above does a good job of showing how a contrarian investor should consider taking the road less travelled, when the public is in panic. If we observe the chart more closely, we can see that intermediate lows tend to coincide with outflows, especially when as dramatic as in 2008 and 2013.
- Last week's commitment of traders report shows that small speculators remain net short the Treasury Long Bond market with almost 40,000 net short contracts. The chart above shows that the government bond market has plummeted in recent weeks. Under this condition, in theory net short bets can persist just as long as net long bets persisted during an uptrend and so far this has been true. For referencing, long term charts of Stocks vs Bonds can be seen by clicking clicking here (updated appropriately from time to time).
Chart 4: Funds continue to dramatically cut their commodity exposure
- Last weeks commitment of traders report showed that hedge funds and other speculators reduced commodity net long bets dramatically for the third week running. Cumulative net long exposure currently stand at 132,000 contracts tracked by my custom COT aggregate, which is the lowest positioning level since at least 2001. Exposure was reduced in agriculture, both the grain and the soft sector, as well as a reduction in the metal sector. Energy exposure slightly increased as Crude Oil bets rose close to a record high.
- West Texas Intermediate Crude Oil has broken out from its prolonged technical consolidation pattern. After moving sideways for a better part of more than two years, the price has finally made a decisive breakout in the last two weeks. However, this is occurring on the back of extremely high speculative net long positions, which usually signal a top... not a bottom. It is also worth noting that this indicator is not perfect at predicting Oils future movements and is also currently in disagreement with Heating Oil COT positioning (which I prefer to use a lot more).
- Commodity Public Opinion surveys are mixed within the commodity complex. As energy rallies, sentiment has risen towards neutral levels. On the other hand, agricultural commodities and metals still remain under pressure. Sentiment on base metals and precious metals, as well as soft commodities like Cocoa, Coffee and Sugar are all in extreme unloved territory.
Chart 6: Hedge funds are building bullish greenback bets again
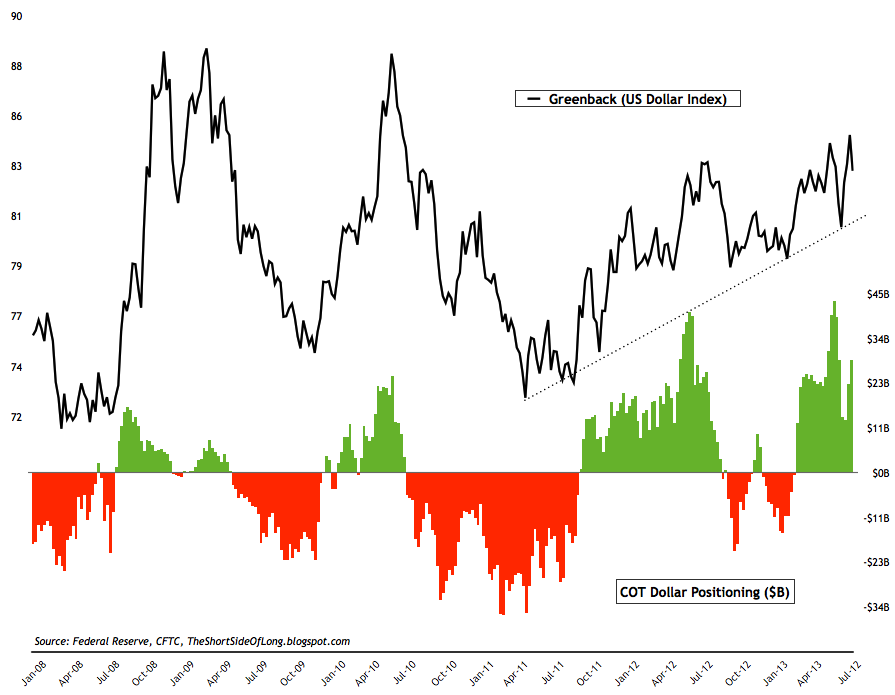
- Last weeks commitment of traders report showed growing exposure towards the US Dollar from a previous week. Cumulative positioning by hedge funds and various other speculators stands at over $28 billon, compared to $22 billion last week and $13 billion two weeks ago. From a technical perspective, it was interesting to see the USD Index break out to new 52 weeks only to sharply reverse on the downside. Keep an eye out on this one...
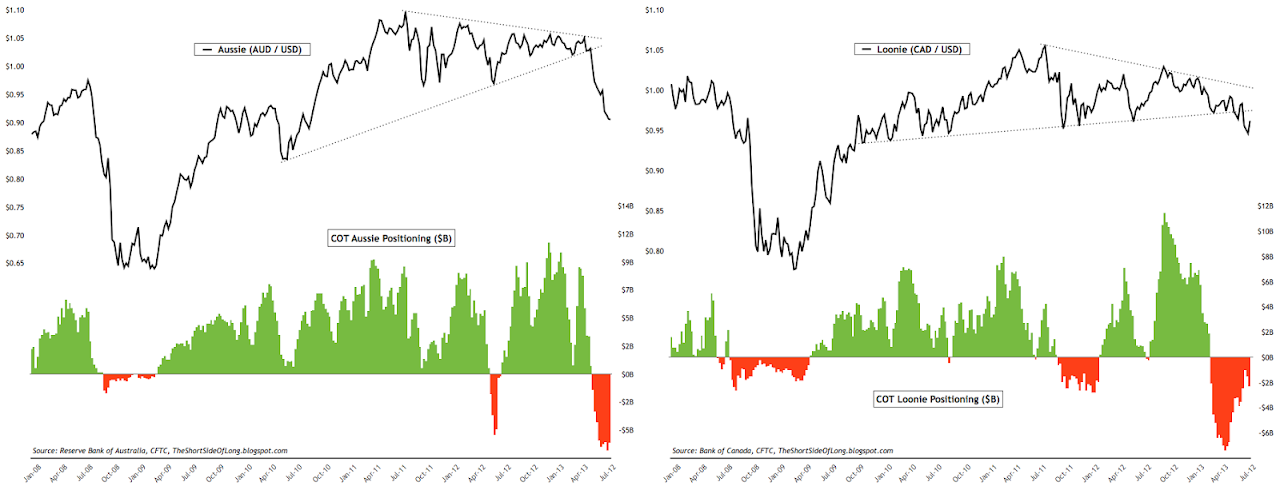
- Hedge funds hold short bets against all foreign currencies from Euro and Yen all the way to Aussie Dollar, where positioning remains near record high net shorts. The chart above shows how both commodity currencies (Aussie & Loonie) have peaked in middle of 2011 and actually broken down in recent weeks. While hedge funds are extremely bearish on the Aussie, they have been covering their net short bets on the Loonie. This has resulted in smaller downside (so far).
- Currency Public Opinion survey readings on the US Dollar has reached bullish extremes associated with intermediate degree tops. At the same time, Public Opinion on the foreign currencies has fallen dramatically. In particular, investors dislike the Pound, the Euro, the Yen, the Franc and the Canadian Dollar.
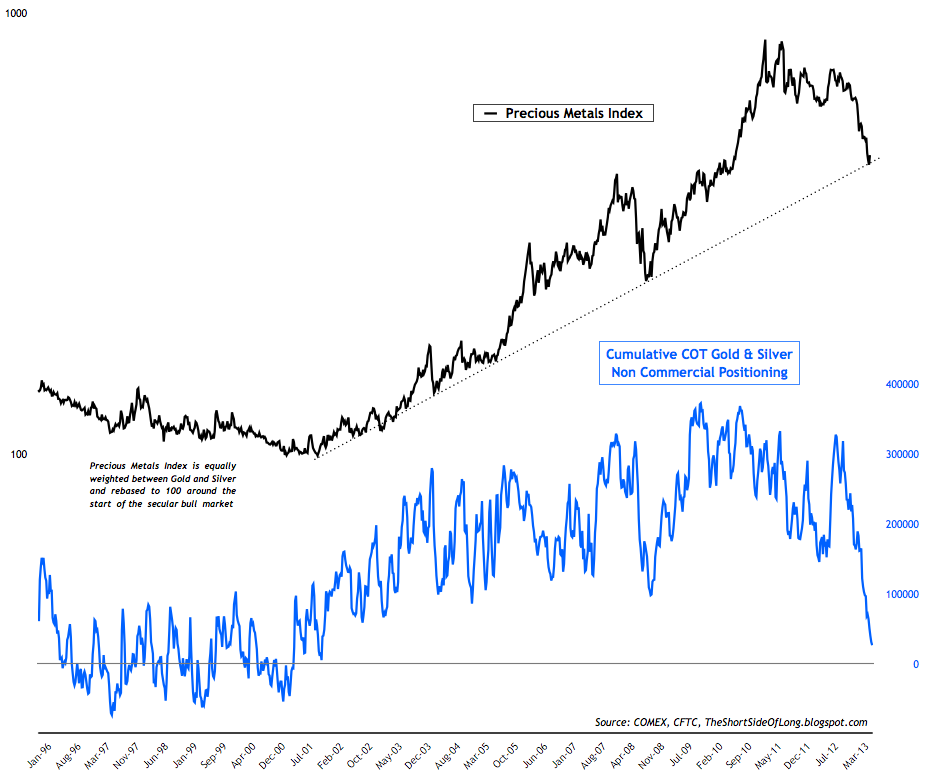
- Last weeks commitment of traders report showed hedge funds and other speculators continuously reducing precious metals exposure. Hedge fund positions on Gold remain at a decade low of 16,500 net longs. At this pace, within a week or two, Gold positioning will be at net short for the first time since late 2000. As a percentage of open interest, both Gold and Silver positioning remains in single digits at 4.4% and 5.2% respectively.
- Public opinion on alternative currencies like Gold and Silver still continues to remain depressed, which is confirming the ultra bearish COT reports discussed above. As stated last week, sentiment can stay negative for a prolonged period of time during bear markets the same way it can remain positive for a prolonged period of time during bull markets.