Technology is what it’s all about these days. Technology (primarily) runs on semiconductors. If the semiconductor business is good, business is good. OK, that’s about as large a degree of oversimplification as I can manage. But while it may be overstated, there is definitely a certain amount of truth to it.
So, it can pay to keep an eye on the semiconductor sector. The simplest way to do that is to follow ticker SMH. Keeping with the mode of oversimplifying things, in a nutshell, if SMH is not acting terribly that’s typically a good thing. So where do all things SMH stand now? Let’s take a look.
Ticker SMH
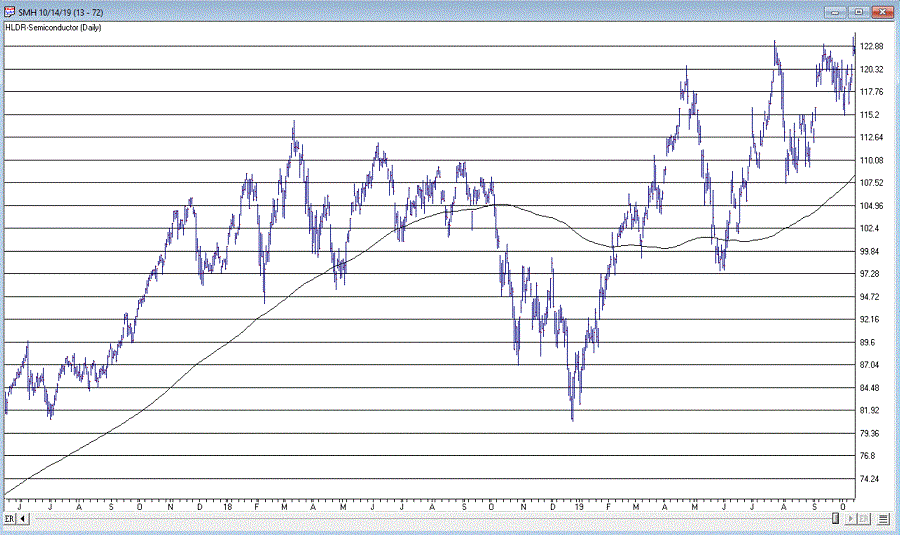
As with all things market-related (among other things), beauty is in the eye of the beholder. A quick glance at Figure 1 argues that SMH is inarguably in a strong uptrend, well above its 200-day moving average.

Figure 1: Courtesy AIQ TradingExpert
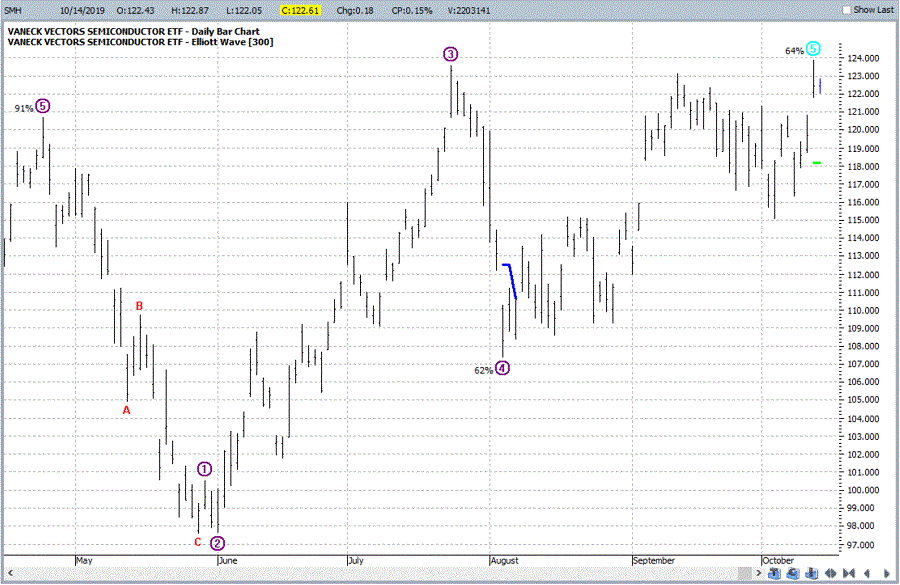
A glance at Figure 2 suggests that SMH has just completed 5 waves up and may be due for a decline.

Figure 2: Courtesy ProfitSource by HUBB
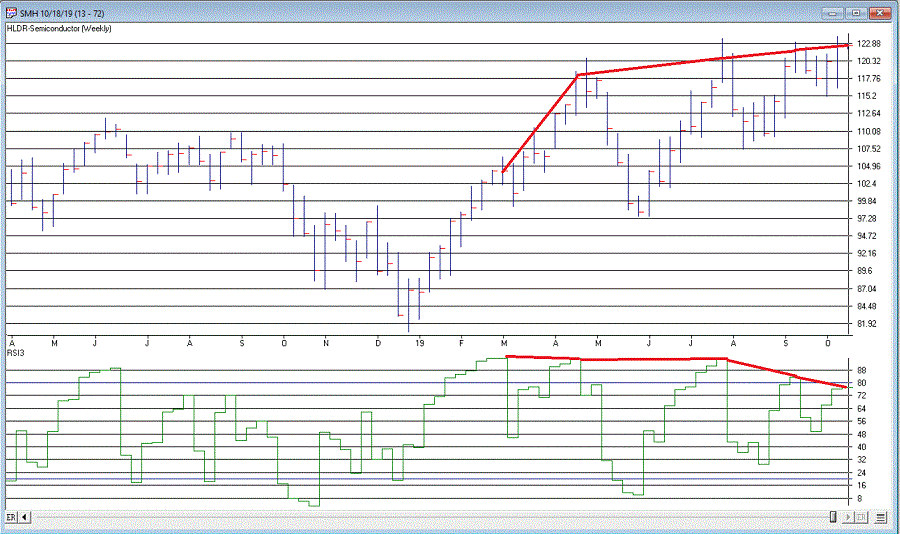
And Figure 3 highlights a very obvious bearish divergence between SMH weekly price action and the 3-period RSI indicator – i.e., SMH keeps moving incrementally higher while RSI3 reaches slightly lower highs each time. Speaking anecdotally, this setup seems to presage at least a short-term decline maybe 70% of the time. Of course, the degree of decline varies also.

So, what does it all mean? First off, I am not going to make any predictions (if you knew my record on “predictions” you would thing that that is a good thing). I am simply going to point out that one way or the other SMH may be about to give us some important information.
Scenario 1 – SMH breaks out to the upside and stays there: If SMH breaks through the upside and runs, the odds are very high that the overall stock market will run with it.
Course of action: Play for a bullish run by the overall market into the end of the year.
Scenario 2 -SMH breaks out briefly to the upside but then falls back below the recent highs: This would be at least a short-term bearish sign. Failed breakouts are typically a bad sign and the security in question often behaves badly after disappointing bullish investors. In this case, if it happens to SMH it could follow through to the overall market.
Course of action: If this happens, you might consider “playing some defense” (hedging, raising some cash, etc.) . Failed breakouts often make the market a little “cranky” (and cranky is one of my fields of expertise).
Scenario 3: SMH fails to breakout and suffers an intermediate-term decline. If I were to fixate only on the bearish RSI3 divergence I showed earlier in Figure 3, this would seem like the most likely result.
Course of action: If SMH sells off without breaking above recent resistance, keep an eye on SMH price via its 200-day moving average. Simple interpretation goes like this: If SMH sells off but holds or regains it’s 200-day moving average then the bullish case can quickly be re-established; If SMH sells off and holds below its 200-day moving average, that should be considered a bearish sign for the overall market.
