The market loves the stimulus by both the Banks and the Government.
Or at least, we can thank both as to why the market stopped the bleed and rallied in some cases, over 20% off the lows.
In the longer term, a lot will depend on COVID-19, and its path to a flattening of the curve or not.
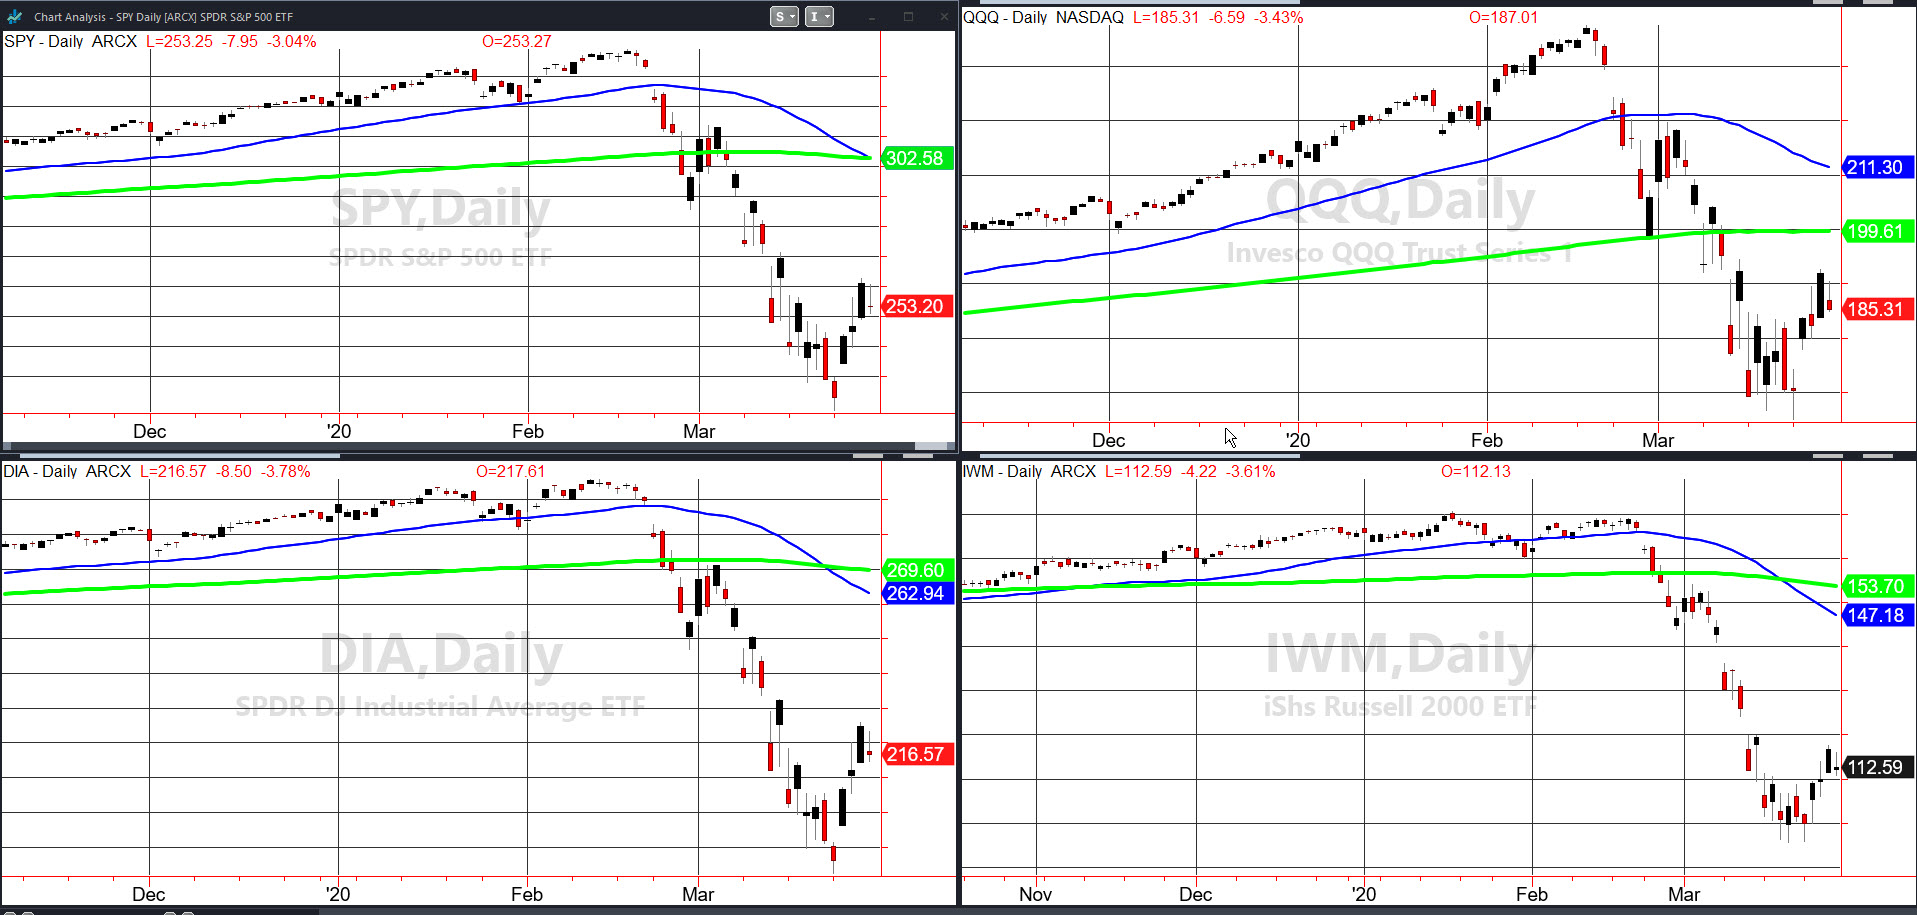
For now, we welcome the relief rally and even more so, the inside days it created in three of the four indices.
The Russell 2000, the exception, broke last Thursday’s low briefly before rallying along with the others without taking out last Thursday’s highs.
Last week, I gave you a road map using weekly opening and closing levels to look at to gauge strength or weakness.
To review, SPY-had to close over 256.35.
The 200-week moving average is 264.0 and a close below 241 not healthy.
The Russell 2000-iShares Russell 2000 ETF IWM had to close over 111.30 and clear 119.47 to keep going
NASADAQ 100-Invesco QQQ had to hold 184.68 and clear 192.40 to keep going
The Dow DIA had to hold 218.31 and clear 232.11 to keep going.
None cleared the upper levels, and instead, gave us these awesome inside days to use Monday (Russell’s close enough).
We must first begin by looking at the phases.
Three of the four (SPY, IWM and DIA) all had death crosses entering bearish phases.
NASDAQ 100 QQQs, has a declining slope on the 50-DMA, but it is still far from a death cross-or a break of the 50 to under the 200-DMA.
I find those that use percentages to gauge a phase and not the standard 50 and 200 DMAs, offer folks misleading information.
Secondly, the V-bottom could end at any time, or it could send the prices up closer to the overhead moving averages.
In 2008, before the big crash, death crosses happened, but the difference was that the price was right near the moving averages.
That offered a very low-risk sell opportunity.
If you have my book, Plant Your Money Tree: A Guide to Growing Your Wealth, I illustrate that clearly, as the book begins with the 2008 crash.
Looking at the inside days, what we can look for Monday, is if the ranges break to the upside or downside.
A break to the downside, or a break of last Thursday’s low, will threaten the V-bottom.
On the flip side, a break to the upside or a break over last Thursday’s highs could mean we see prices closer to the overhead MAs.
Either scenario presents trading opportunities.
A break above, looking at SPY, could mean a trip from over 262.80 to closer to 300.
A break below 249.05, could mean that the stimulus’ impact is short-lived, with the fears of the damage the virus is doing and will continue to do to people and the economy, is far from over.
Either way, we also have our outliers to refer to.
LQD or High Yield Investment Grade Bonds closed over the 200-week moving average at 119.96. It also closed above the prior week’s high 122.05. That becomes immediately pivotal for Monday.
Junk Bonds JNK closed above 93.49 but not above the prior week’s high at 96.89.
Oil USO (NYSE:USO) held 4.29, recent lows, with a low on Friday at 4.33. However, until it gets over 6.00, the performance remains troublesome.
Regardless of whether we sell weakness or sell strength-ultimately, this market is a short. Once the setup reveals itself, we can better determine the risk/reward.
S&P 500 (SPY) Inside day range-249.05-262.80
Russell 2000 (IWM) Range to break-110.87-117.60
Dow (DIA) Inside day range 214.01-225.87
Nasdaq (QQQ) Inside day range-183.61-192.72
KRE (Regional Banks) Inside day-range 31.65-34.73
SMH (Semiconductors) Not an inside day-worse, closed under Thursday’s low-108.50 underlying support unless this can clear 120
IYT (Transportation) Also broke Thursday low. 131.25 support 144 resistance
IBB (Biotechnology) 110 resistance and 101 support
XRT (Retail) 29.39 has to hold and 31.65 resistance
Volatility Index (VXX) 50-60 range to break
