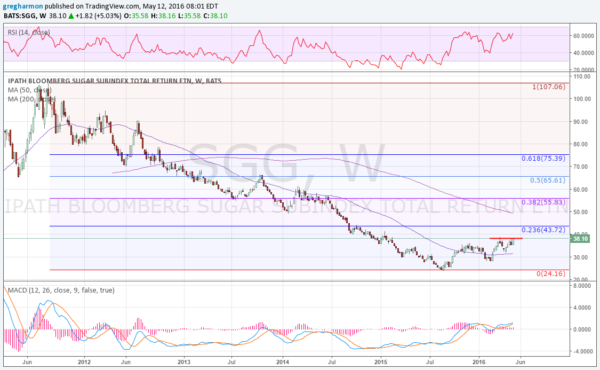
Sugar may have been the biggest drain and cost to the US economy over the last 20 years. Obesity, diabetes you name it. The commodity has paid a price over the last 5 years. Sugar, as measured by the ETF (NYSE:SGG), has fallen from a high of more than $107 to a low last July at just over $24. That's an 87% drop in value.
But now it might be time for cooler, more analytic heads to prevail. Sugar looks to have found a bottom and is ready to reverse back higher. The chart below shows that the ETF has made a series of higher highs and higher lows since the bottom in July 2015. It has also moved over its 50-week SMA, retested it on a pullback and held, moving back higher. It hasn't spent that much time above the 50-week since its last leg higher.

Momentum has turned decisively positive as well. The RSI is in the bullish zone and rising and the MACD is crossed up and rising. Coming into the end of the week, the price is at resistance and looking to push through to the upside. This is a natural buy trigger as it gives a stop loss for short-term trades at the break of resistance, plus for intermediate-term traders at the prior low near $28.
How high will this sugar rush go? We will have to wait and see, but a typical bounce would look to retrace at least 38.2% of the downward move. That would be to a price of over $55. A strong bounce would look for a 61.8% retracement to $75. Are you ready to get a sugar high?
