Sometimes just knowing what direction things are moving is enough. You do not need to know all the bumps along the way, just if there is a boulder or disabled car in the road ahead of you that would require a detour or make you abandon the trip.

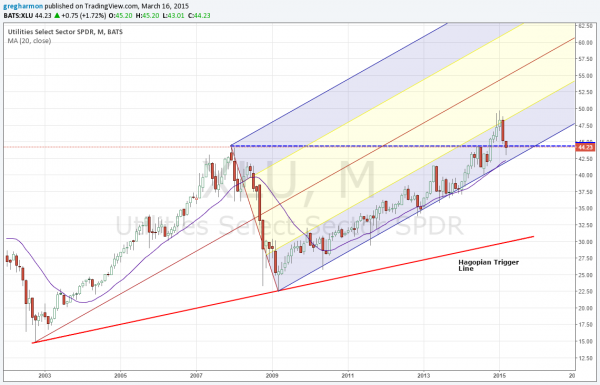
In technical analysis the Andrew’s Pitchfork can be used as the tool that gives that clearer view. Above is the Andrew’s Pitchfork, applied to the Utilities Select Sector (NYSE:XLU). What does it say? Despite the recent two-month pullback, the trend in Utilities remains higher.
If you are not familiar with this tool there are a few things to notice. The lower bound of the Pitchfork, or Lower Median Line, has been acting as a guide for the Utilities pushing them higher. A technician would tell you that the uptrend is not at risk until the index falls below the Hagopian trigger line. Not many would tolerate a move from 42.50 to 30 before giving up on the uptrend though.
A much tighter measure is that Lower Median Line. I have added one more indicator that you might be familiar with, the 20 month Simple Moving Average. As a rough guide this has also bee acting as support for the ride higher, moving along with that Lower Median Line.
So all the Utilities have done so far is come back to the trend. It is finding support above the Lower Median line and at the prior high from December 2007 and June 2014. No trouble yet.
The information in this blog post represents my own opinions and does not contain a recommendation for any particular security or investment. I or my affiliates may hold positions or other interests in securities mentioned in the Blog, please see my Disclaimer page for my full disclaimer.
