Sector Performance Week In Review For June 24-28Summary
- Defensive sectors sold off a bit this week.
- More aggressive sectors are outperforming in several time frames.
- Still, the fundamentals don't support a move to a more aggressive investment stance.
Investment thesis: Despite the improving performance of more aggressive sectors, the underlying economic fundamentals don't support a change to a more aggressive investment stance. Defensive sectors still make the most sense.
Let's start with the one-week table:
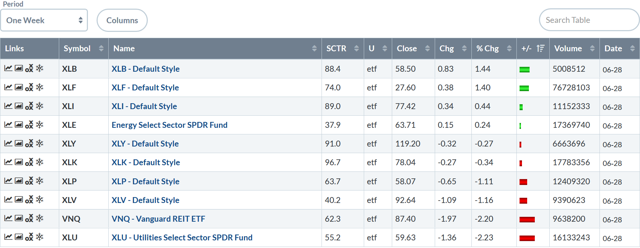
This is an odd table. Six of ten industries were down - a bearish development, especially as the sectors that rose only comprise 30% of SPY (NYSE:SPY). Basic materials led the group higher, as traders bet that dovish central banks would help the sector. Financials were second and industrials were third. Defensive sectors were the four worst performers; all were down. The two sectors that best showcase a growing economy - technology and consumer discretionary - were fractionally lower.

All sectors are up in the one-month chart. Most importantly, the sector orientation is taking a more bullish tone. As with the one-week table, basic materials are leading the way. But technology, industrials, and consumer discretionary round out the top four performing industries. Defensive sectors are again near the bottom of the table: healthcare, staples, utilities, and real estate occupy the 6, 8, 9, and 10 spots respectively.
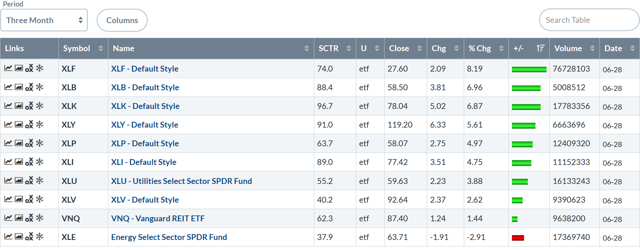
Nine of ten sectors are up - a bullish sign. And the top four spots are occupied by aggressive sectors - financials, basic materials, technology, and consumer discretionary. Aggressive sectors have rallied significantly more than defensive ETFs; the top four sectors have risen 6.90% on average while the four defensive sectors are up 3.22% - half as much.
For most of the spring, defensive sectors led the market higher. This week's tables contain a potential reversal of that development. In the tables above, basic materials, technology, and financials are leading the way higher. This doesn't mean, however, that investors should take a more aggressive investment position. The underlying fundamental data also means we should consider it unlikely. Instead of a sea-change in the market's sector performance, we're probably witnessing the "last hurrah" of the bulls for this cycle.
Let's develop that theory in more detail by starting with the fundamental data.
- According to the latest BEA report, corporate profits declined in 1Q19.
- New orders for consumer durable goods and business equipment are moving lower on a Y/Y basis.
- The average weekly hours of production and non-supervisory employees are at their lowest level in five years.
- The yield curve is modestly contracted.
- Various measures of the belly of the curve have been inverted for at least a few months or since the beginning of this year.
- Building permits are still trending lower.
- The four-week moving average of initial jobless claims appear to be bottoming.
- Industrial production is trending lower.
The above data isn't conclusive. But there are a number of long-leading, leading, and coincidental data points that are behaving in a pre-recessionary manner.
"What about the Fed?" Yes, it's stated it is now more dovish. But that change of tone is due to softer economic data and concerns about U.S. and global growth slowing.
Next, let's look a bit deeper at the charts of the four largest SPY sectors:
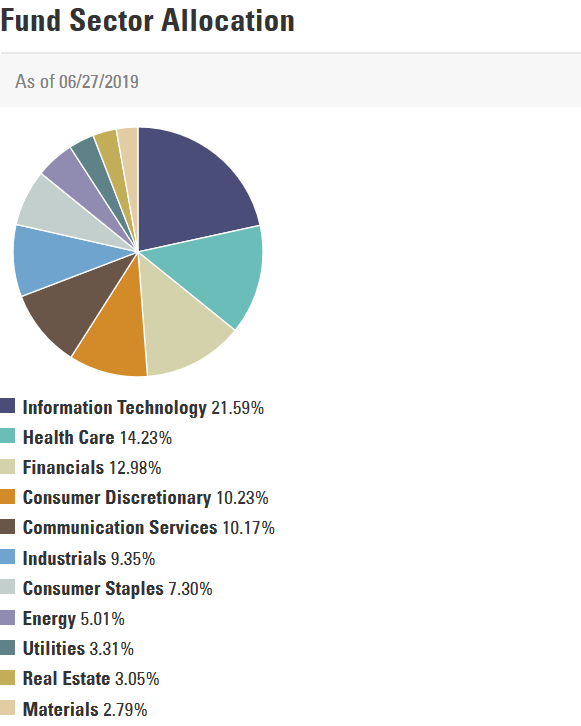
Let's start with the largest (technology) and move down the list.
Technology
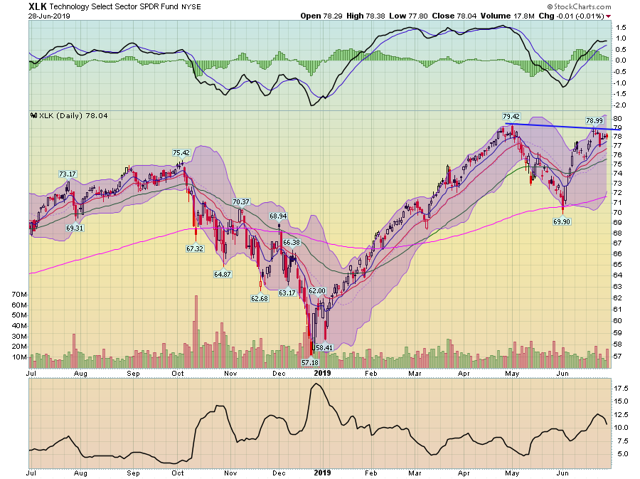
On the daily chart, prices recently peaked just below the high from late April. Prices have moved a touch lower since peaking at 78.99 in mid-June. The MACD does have additional room to move higher (and could stay at high levels, moving sideways for a number of months). But, with weaker fundamental data, it's just as likely XLK is forming a top of some sort. To counter that argument, prices would have to rally through the 79.42 level of late April/early May.
Healthcare
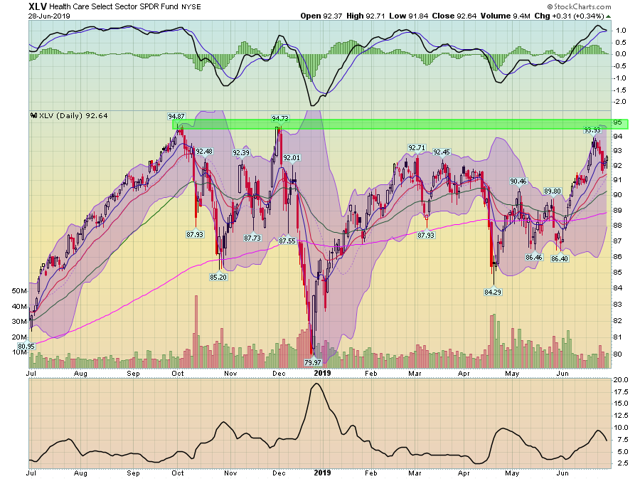
Healthcare's daily chart is fairly positive. Prices have advanced through highs from earlier in 2019. They have pulled back to the 10-day EMA for a potential run at the mid-90s highs from late 2018. The fundamental backdrop is a problem, however. Democratic candidates are regularly attacking private healthcare. While Republican attacks occur less frequently, they are still happening in a more targeted fashion. It's difficult to see this sector staging a meaningful rally in this environment.
Financials
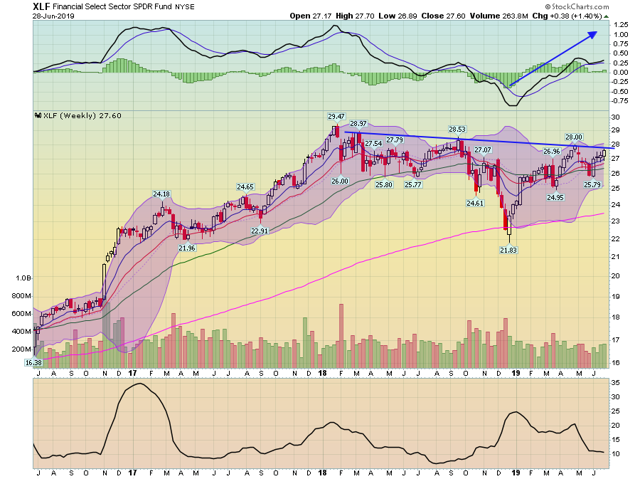
The weekly financial chart has a downward trend, with prices making progressively lower highs.
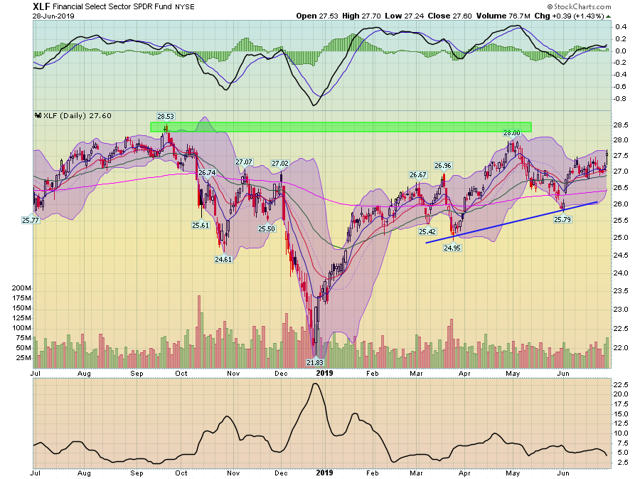
The daily chart has a modest upward slope. Unfortunately, prices remain constrained by highs from late 2018. The fundamental picture is bearish: the Fed is cutting rates, which will eventually decrease institutions' net interest margins and profits.
Consumer discretionary
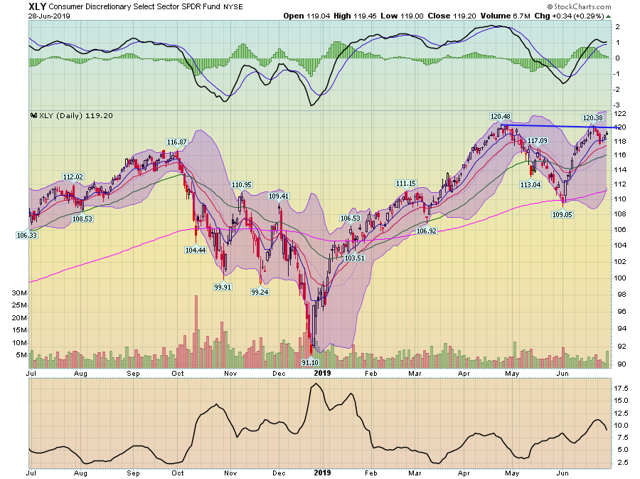
The consumer discretionary chart is very similar to XLK. Either XLY is forming a double top/topping pattern or it is consolidating recent gains to make a move above the 120.40 level. Fundamentally, recent consumer spending data has been positive, which could support a move higher.
Two of the four largest SPY sectors face fundamental headwinds. The financial sector's profits will begin to be constrained by a shrinking interest rate spread. It's also likely that problem loans will begin to increase. Healthcare is under a political assault from both parties. Only technology and consumer discretionary have a decent fundamental picture. But their charts are a bit more constrained technically.
