Sector Performance Review For The Week Of April 29-May 3Summary
- Longer-term sector performance remains bullish.
- 3/5 of the top-performing ETFs for the last week are defensive.
- I take a deeper look at the financial services sector.
Let's start with the three performance tables, starting with this week's performance:
In my mid-week review, I noted that the performance had taken a defensive turn:
Healthcare is now the top performer, up 2.41%. Two other defensive sectors - staples and real estate - are the number three and four performers, respectively.
By the end of the week, overall sector performance had become a touch more aggressive, with financials in the top position (+1.34%), and industrials at number three (+1.14%). Defensive sectors were still three of the top five, meaning the market was less bullish this week. Discretionary was off modestly, while raw material sectors (basic materials and energy dropped.
Performance is a bit more aggressive in the one-month time frame:
XLP (a defensive sector) is number two. But other defensive sectors are 6, 7, and 9, respectively. Financials are leading the pack again, up. 6.33%. Technology, consumer discretionary, and industrials are numbers three, four, and five, respectively, which is a far more expansionary orientation.
And over the last three months, sector performance has been very bullish: technology, consumer discretionary, and industrials are in the top three slots. Technology is the clear winner, up nearly 19%. Performance tapers off a bit after that (relatively speaking); discretionary is up 12.5%, while industrials rose 9.7%. Only two sectors are down and then only marginally. Overall, the market has been strong for the last three months.
So why are financials rising to the top of the list? It's a pretty good time to be a bank:
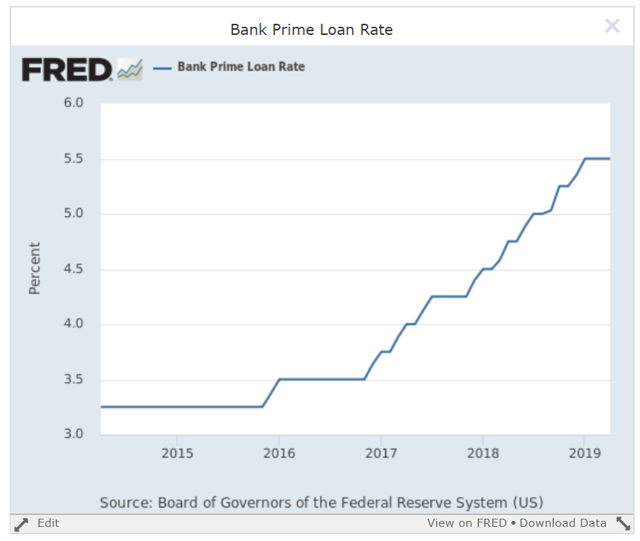
The prime rate is at a five-year high.
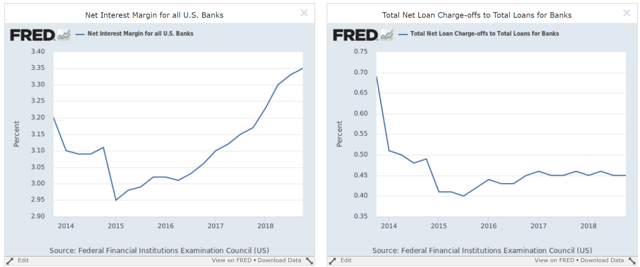
The net interest margin (the spread between deposits and loans) is at a five-year high (left chart) while the net charge-off total (right chart) is low.
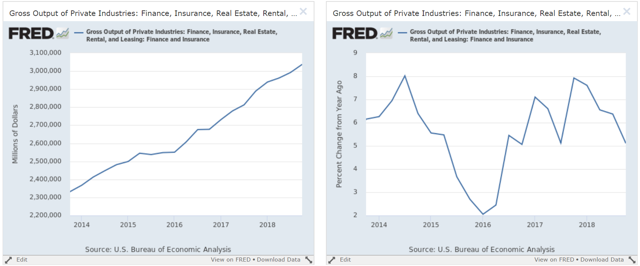
Total earnings (left chart) are at a five-year high; the Y/Y pace of earnings growth (right chart) is down, but still at a healthy 5%.
Let's turn to the XLF chart:
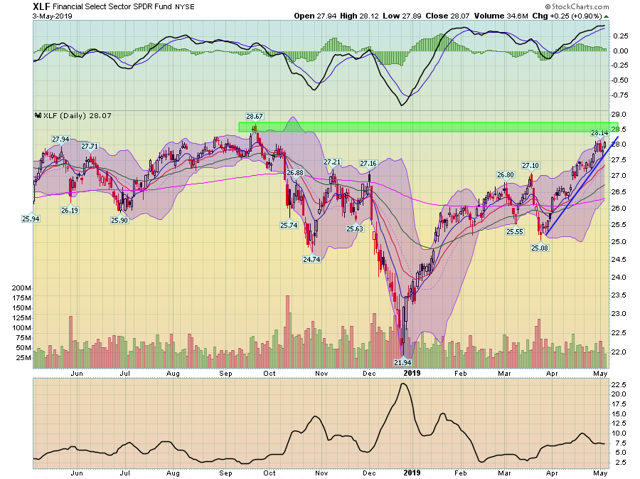
Like other sectors, XLF started to rally at the end of last year. The first leg of the rally lasted until early February. The ETF then traded sideways for two months before breaking through resistance in mid-April. Prices are now just shy of the 28.67 level from mid-September.
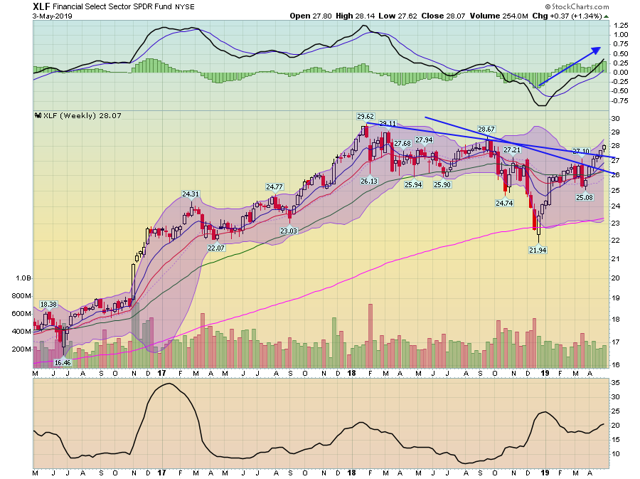
On the weekly chart, prices have broken through two trend lines - one that connected highs from January and September 18 and a second that connected highs between September 18 and March 2019. Momentum is rising and the moving averages are bullish.
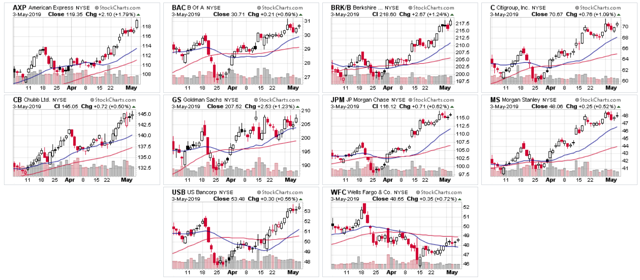
Finally, 9/10 of the CLF's largest components are rallying:
Goldman Sachs (NYSE:GS) (middle row, second from left) is moving sideways but is still near a high. Wells Fargo (NYSE:WFC) (bottom right) is in the lower 1/3 of its chart. The other stocks are bullish.
After a solid run in the spring, it appears the market is becoming a bit more defensive this week.
Disclosure: I/we have no positions in any stocks mentioned, and no plans to initiate any positions within the next 72 hours. I wrote this article myself, and it expresses my own opinions. I am not receiving compensation for it (other than from Seeking Alpha). I have no business relationship with any company whose stock is mentioned in this article.


