Summary
The market continues to shift to a defensive sector rotation.
Increases continue to shrink relative to the Spring's gains.
As the market turns more defensive, it's harder for the SPDR S&P 500 (NYSE:SPY) to sustain a rally.
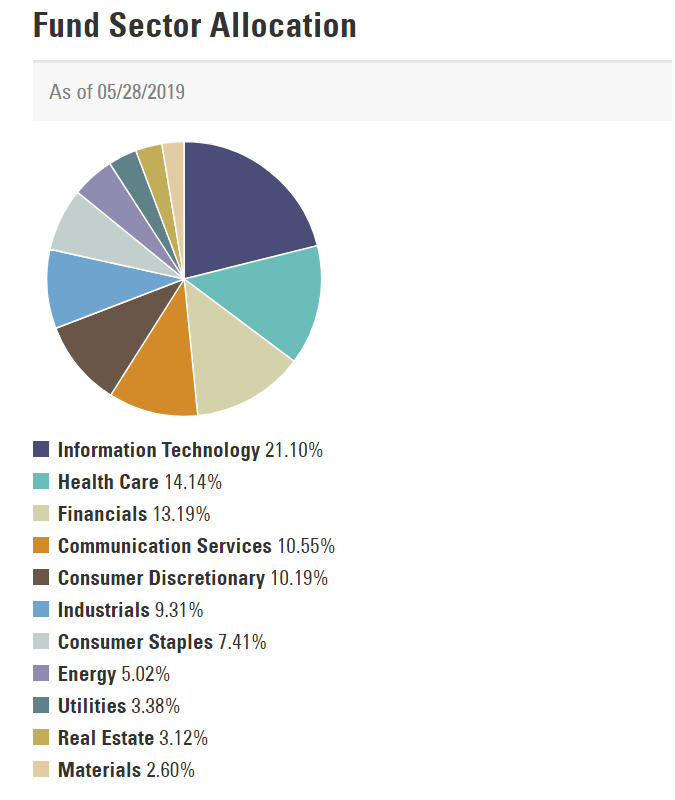
Rather than start with the performance tables, let's first consider the composition of the SPY:
Information technology and communication services account for 32% of the SPY. In comparison, the sum total of the defensive sectors is 28%. This is a statistically important point: a tech rally alone has a decent chance of pulling the market higher. That's exactly what happened this Spring; the Technology Select Sector SPDR (NYSE:XLK) was forming a very strong upward sloping trend. Now that tech has fallen out-of-favor, the market has a much harder time moving higher because four sectors have to rally at the same combined rate as one sector. The situation is far more complex with the Invesco QQQ Trust (NASDAQ:QQQ), where tech makes-up nearly 50% of the index.
That said, let's look at a 1-year performance table:

The four defensive sectors are at the top of the chart: utilities, staples, real estate, and healthcare occupy positions 1, 2, 3, and 4. The good news is the top three gains are pretty substantial. The bad news is utilities - which are 3.38% of the SPY are the top performer, followed by staples (7.41%, +16.13), real estate (3.12%, +15.12) and healthcare (14.14%, + 7.99%). Not only does this show that traders are now very defensive about the market as a whole, but it also explains why the SPY just barely advanced above a previous high before moving lower and why the smaller-cap indexes have had a difficult time advancing.
The defensive tone is now permeating multiple time periods, starting with the 6-month performance table:
Only 6/10 sectors are up, which is a noticeable change from the last few months when all sectors rose. During the Spring, technology was the big winner, up 15%+. It's still number one, but its overall gain is now 8.9%. That's followed by utilities and real estate, two defensive sectors. The top three sectors' overall total gains are very close: tech gained 8.9% while real estate is up 8.18% - a less than bullish development. Consumer discretionary - which was also up 10% plus for most of the Spring - has now gained about 5%. At the bottom, we see healthcare (which is under a fair amount of political risk right now) and energy.
While 6/10 sectors are up over the last three months, the gains are less than impressive; the top three performers are up less than 4% each. And - they're all defensive, with staples, real estate, and utilities occupying the 1, 2, and 3 slots. The losses for numbers 8, 9, and 10 are all larger than any of the gains.

Now, only 2/10 sectors are up. And the losses at the bottom of the table are much larger than the gains - energy is down 8.98% while utilities have advanced 1.13%. Defensive sectors occupy all four top spots – and only two of those are in the green.
Finally, we have the 1-week chart:

All 10 sectors have declined - some pretty sharply. Energy is down slightly more than 5%; industrials declined 2.83%. The XLP – a defensive sector – is the 8th worst performer, down 2.81%. The two top gainers are real estate and utilities, and both of those are down.
Let's tie all this together.
At the sector levels, total gains are lower across all time frames. During the Spring, tech and discretionary were up 15% in the 3 and 6-month time period. And all sectors were up; it was simply a matter of degree. Now, the gains are shrinking and defensive sectors are rising to the top of the performance tables. And since four defensive sectors account for the same percentage of the SPY as tech, it's harder for the SPY to post meaningful gains.
Disclosure: I/we have no positions in any stocks mentioned, and no plans to initiate any positions within the next 72 hours.
