On the other end of the equity spectrum is the S&P 500 Low Volatility ETF (SPLV.K), which holds more defensive-oriented stocks, such as McDonald's (NYSE:MCD), Wal-Mart (NYSE:WMT) and Johnson & Johnson (NYSE:JNJ).

Common Sense Says Tone Has Shifted
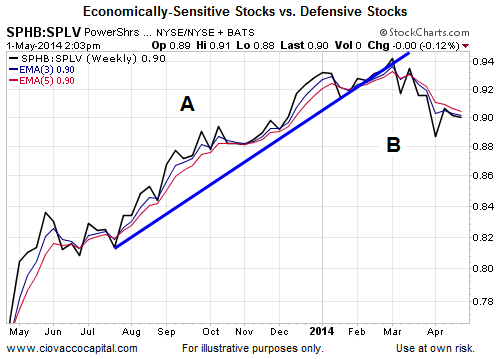
The chart below shows the performance of high beta stocks relative to defensive stocks. In the second half of 2013, the ratio showed strong bullish conviction about future economic outcomes, earnings, and Fed policy (below point A). Economic doubt began to creep in above point B, telling us the market’s tolerance for risk has been deteriorating for several weeks.

Yellen The Magnificent
It seems as if elected politicians are doing less and less and the Fed is doing more and more, which is a theory shared by many money managers. From The Wall Street Journal:
Hedge-fund manager Paul Singer has a nickname for Federal Reserve Chair Janet Yellen: “Yellen the Magnificent.” But the spin on Johnny Carson’s famous mocking mystic sketch is not a compliment. “The Fed has lost any semblance, any wispy remnant of humility, introspection, caution and historical perspective. It is all cameras and applause,” he wrote in the letter, sent last week. “The Fed (along with other central banks) is fully immersed in fiscal policy, arrogating more and more responsibility for the functioning of the global economy, picking winners and losers in purchasing financial assets, directing the allocation of credit and making ever-bolder predictions ever-further into the unknowable future.“In effect, it is achieving total political power in a political vacuum, without the accountability of being elected,” he added. “If you open a faucet in the winter and only a trickle comes out, what do you do? Easy! Open it wider. In fact, open ALL the faucets! Brilliant! Now they are all trickling. But when the pipe blockage comes unstuck or the ice melts, you will have a flood,” he wrote.
Having the Fed do all the heavy lifting is a plan that could backfire sometime down the road.
Investment Implications – Not Much Has Changed
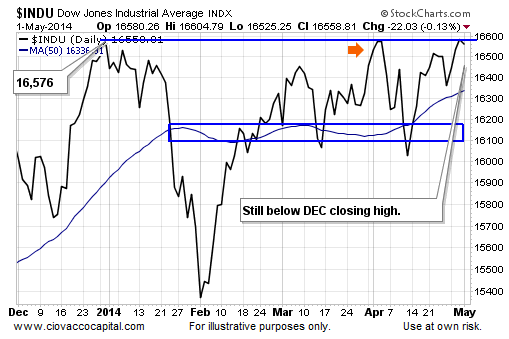
On April 4, we noted the possible economic significance of the Dow being able to post a new closing high. Industrial stocks finally cleared the hurdle Wednesday. How long did the euphoric breakout state last? For now the answer is “one day”. As shown in the chart of the Dow below, Thursday’s decline in industrial stocks moved the breakout into possible fake-out territory. If the breakout fails, that also provides insight into perceptions about the strength of the economic recovery.

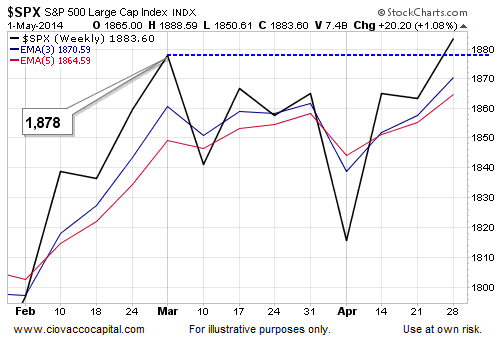
Ahead of the non-farm payrolls report and, given the market’s seemingly never-ending bout of indecisiveness, we have made no changes this week. If you want to really know what someone thinks about the market, ask them what they own. We own a fence-sitter’s portfolio with a slight bullish bias, consisting of (U.S. stocks), iShares Barclays 20+ Yr Treasury (bonds) and cash. The SPHB vs. SPLV ratio discussed here says it remains prudent to have some bonds and cash to offset increasing risks in the equity markets. In Friday’s article, we will post an updated version of the weekly S&P 500 chart below. It will be interesting to see if the bullish look and 18 point gain can carry into the weekend. We will see what Friday brings.

