Summary
- With the exception of utilities and staples, all the sectors were up this week.
- We're starting to see more aggressive sectors perform better.
- I take a deeper look at the industrials.
Over the last few weeks, we've seen the sector performance turn decidedly bearish, with staples, healthcare, and utilities leading the pack. That orientation is changing a bit, which is good news for the bulls.
This week, the energy sector was the best performer, rising 2.66%. This was followed by consumer discretionary and technology. Utilities and staples - which have been top performing sectors - sold off this week.
For the one-month time frame, healthcare is still number one and utilities are number three. But industrials are now number two on this list, rising 3.27%. And consumer discretionary is number four; it's up 2.86%. Energy, which is still feeling the effects of weaker oil prices, is the only sector lower.
The three-month table is still led by defensive sectors - healthcare and staples. But discretionary is now number three. This is followed by utilities and then tech.
Next, let's look at the relative strength of the sectors:
This table and chart show the relative strength over a 10-week period - or 2 1/2 months. Defensive sectors are either improving (Consumer Staples Select Sector SPDR (NYSE:XLP)) or leading (Health Care Select Sector SPDR (NYSE:XLV)) (Utilities Select Sector SPDR (NYSE:XLU)). Discretionary, technology and energy are weakening, while financials, industrials, and basic materials are lagging. But note that financials and industrials are moving higher and could soon be in the "improving" section.
Industrials have taken it in the teeth for the last few months on account of the increased use of tariffs by the Trump administration. But with their prospects improving somewhat, it's time to at least look at the charts to see if we can find some attractive undervalued candidates.
Let's start with the daily chart:
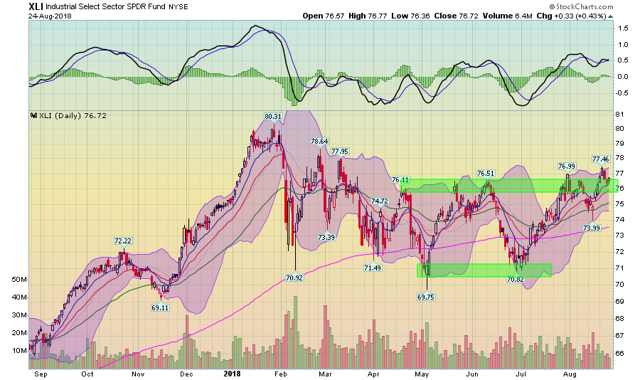
The general trend is that prices are trading between the upper 60s and mid-70s since early April. The chart has dipped slightly below the 200-day EMA twice this year but has bounced back each time. Prices are now at the upper end of their trading range. Notice that the shorter EMAs are bullishly aligned while the MACD has plenty of upside room to run.
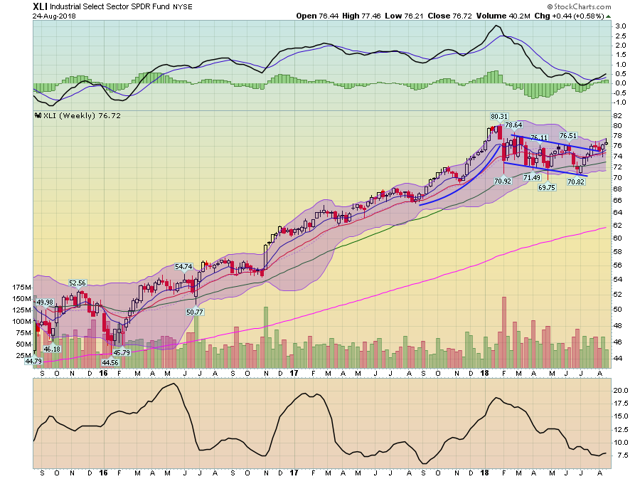
This is the chart that should really excite the bulls. Prices were in a year-long rally in 2017 and formed a modest parabola at the end of last year that topped in the spring. This is a classic selling climax development. Prices have let off some trading steam, forming a downward sloping channel through the spring and summer when the U.S. launched its tariff offensive. While this obviously hurts the sector, it hasn't sold-off sharply or entered bear market territory. Now the chart has broken through top-side resistance. Pay particular attention to the MACD, which has given a buy signal and has plenty of upside room.
Let's turn to the charts:
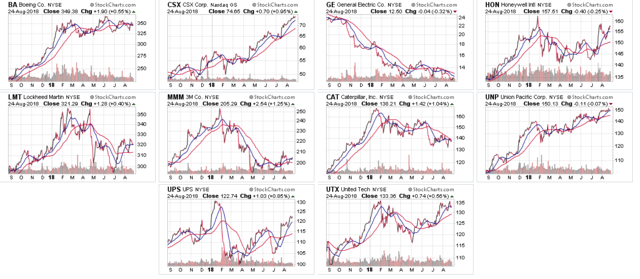
Let's organize these, starting with those at/near 52-week lows. This includes General Electric Company (NYSE:GE) and 3M (NYSE:MMM). GE is in the middle of a turnaround while MMM is suffering from stagnating top-end sales. Then we have Lockheed Martin (NYSE:LMT), Caterpillar (NYSE:CAT), and United Parcel Service Inc (NYSE:UPS), all of which are in the middle of their 52-week ranges. LMT should benefit from the increase in defense spending in the latest federal budget. I would be modestly concerned about CAT because of the international trade situation. However, UPS should benefit from the upcoming holiday season. Stocks near 52-week highs are usually attractive under the assumption they're poised to move higher. As an aside, it's particularly encouraging that both rail issues, CSX (NASDAQ:CSX) and Union Pacific (NYSE:UNP), are near 52-week highs under Transportation theory assumption.
Let's look at these from a valuation perspective:
With the exception of GE and CAT, everybody's expensive on a current basis. This shouldn't be surprising; the market overall is pricey.
There's some potential value on a forward PE basis: CAT, GE, UPS, and LMT are all attractive.
Only one issue, GE, is over 3% yield. But there you have to remember that the company is reorganizing, so shareholder payments aren't entirely safe. UPS is right under 3%. After that, the yields are somewhat standard.
So, we have some potential targets from a technical perspective: GE, MMM, and UPS.
Disclosure:I am/we are long MMM, GE.
I wrote this article myself, and it expresses my own opinions. I am not receiving compensation for it (other than from Seeking Alpha). I have no business relationship with any company whose stock is mentioned in this article.


