Summary
This week, defensive sectors had the best performance.
We're also seeing defensive sectors outperform on a monthly basis.
I take a deeper look at the industrial and basic materials sectors.
As always, let's start with the weekly performance table:

For the second week in a row, utilities) led the pack, rising 2.44%. This was a very large increase relative to the next biggest gainer, the XLE. The only other sector to rise was the XLP, which was up marginally. The two worst performing sectors are directly in the line of trade war fire: theXLB and XLI. Also note the conservative nature of this week's performance numbers: defensive sectors outperformed more aggressive sectors. We're also seeing this orientation in the monthly performance numbers:

One month of performance data isn't enough to call it a trend. But it's something to definitely keep our eyes on.
Let's next look at sector ETF performance relative to the SPY:
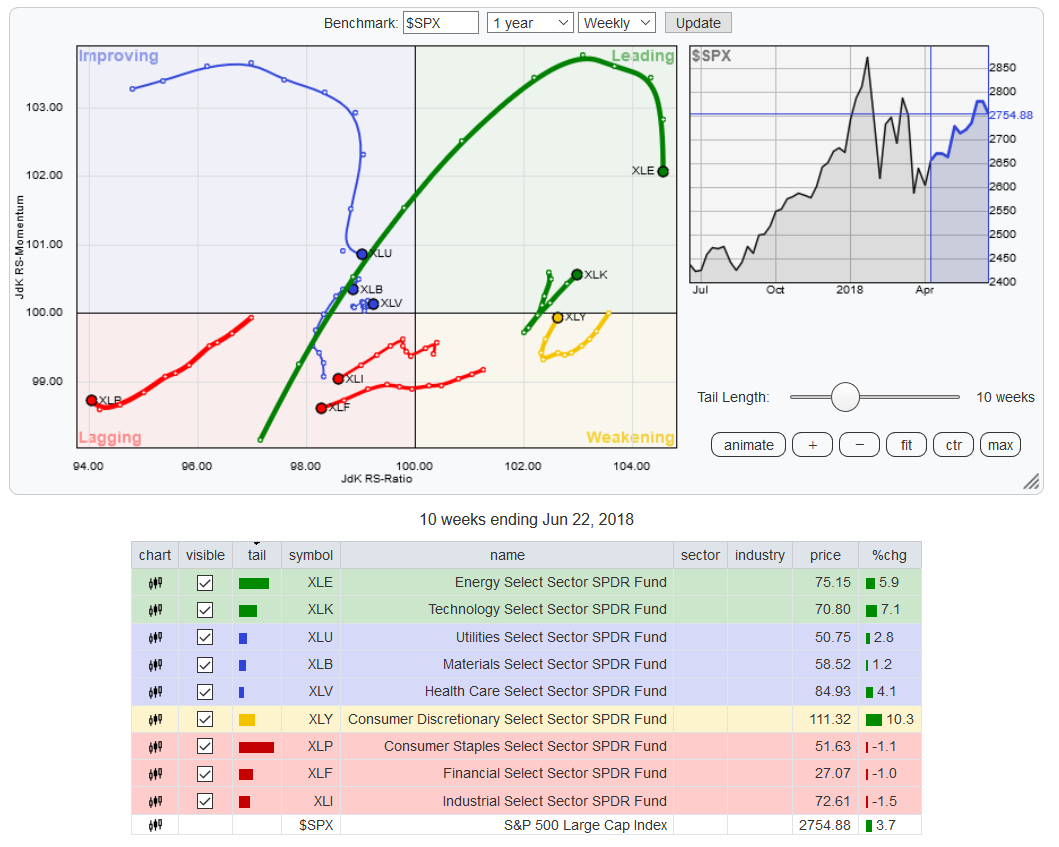
The energy sector is still outperforming. But with OPEC agreeing to a supply increase, expect traders to take some profits. Tech is now rising relative to the SPYs, and consumer discretionary is starting to move into that category. Looking at the improving sectors, we see a more defensive orientation: utilities and healthcare are two of the three sectors in this category. Finally, basic materials), industrial and financials are underperforming. The first two will bear the brunt of the trade war while the latter will have to deal with narrowing spreads and hence lower profits.
Next, let's look at the yearly chart of the major sector ETFs:
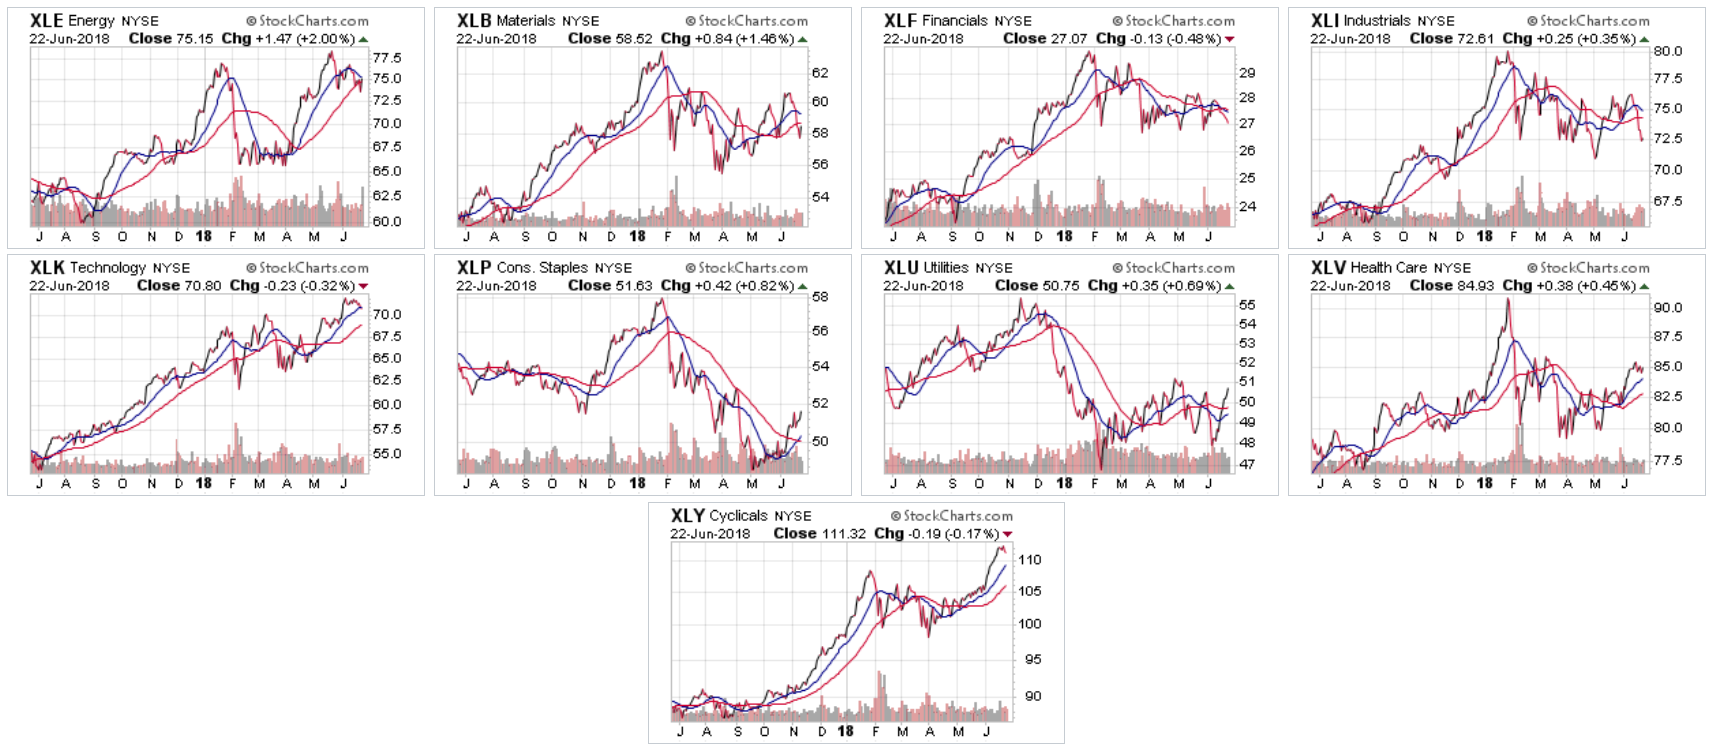
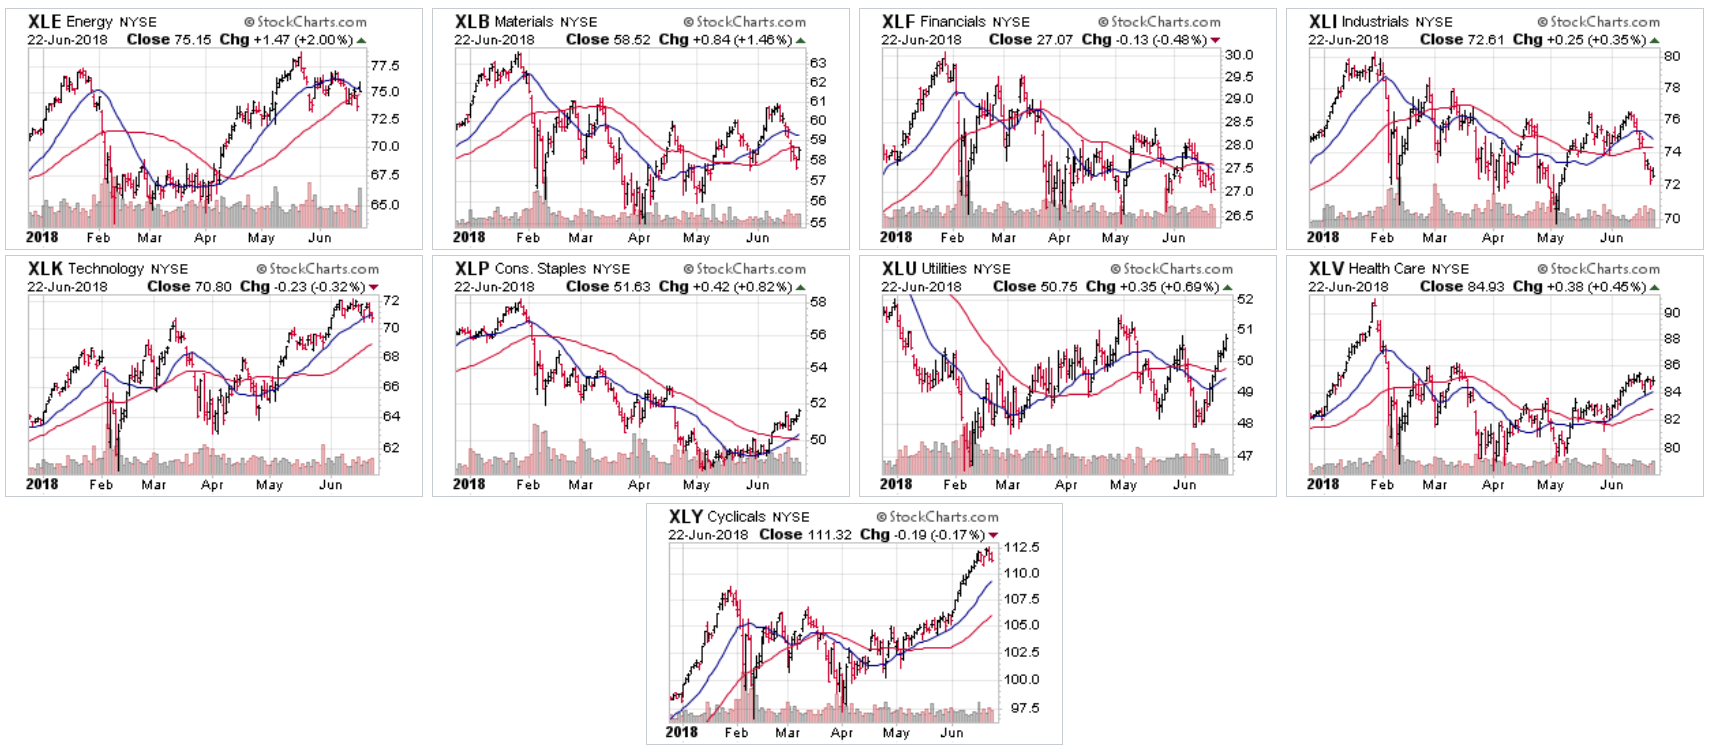
There is a remarkable lack of solid uptrends. The five charts (XLB, XLF, XLI, XLU, and XLV) are consolidating. The XLPs are near a 52-week low. Technology and consumer discretionary are rallying. Combined, these two comprise about 40% of the index, which partially explains why the SPYs haven't dropped. But relying on two sectors for continued strength is not great.
Here's the same group of charts but with a six-month time frame to show the technical situation in more detail:
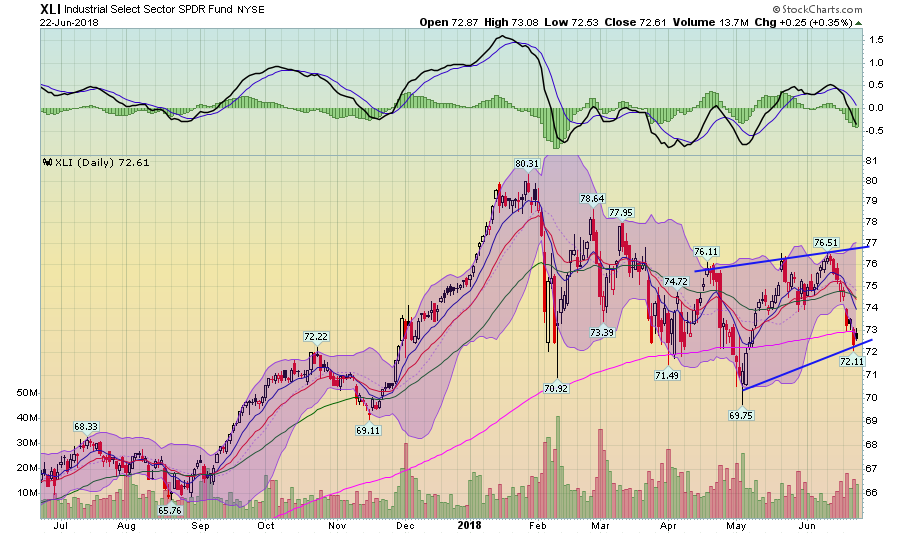
Let's now turn to the two underperforming sectors: the industrial and basic materials ETFs, starting with the former:
The XLI fell with the rest of the market when the broader averages sold-off at the beginning of the year. They now have a slight uptrend, but they're in more of a consolidation pattern using the 200-day EMA for technical support.
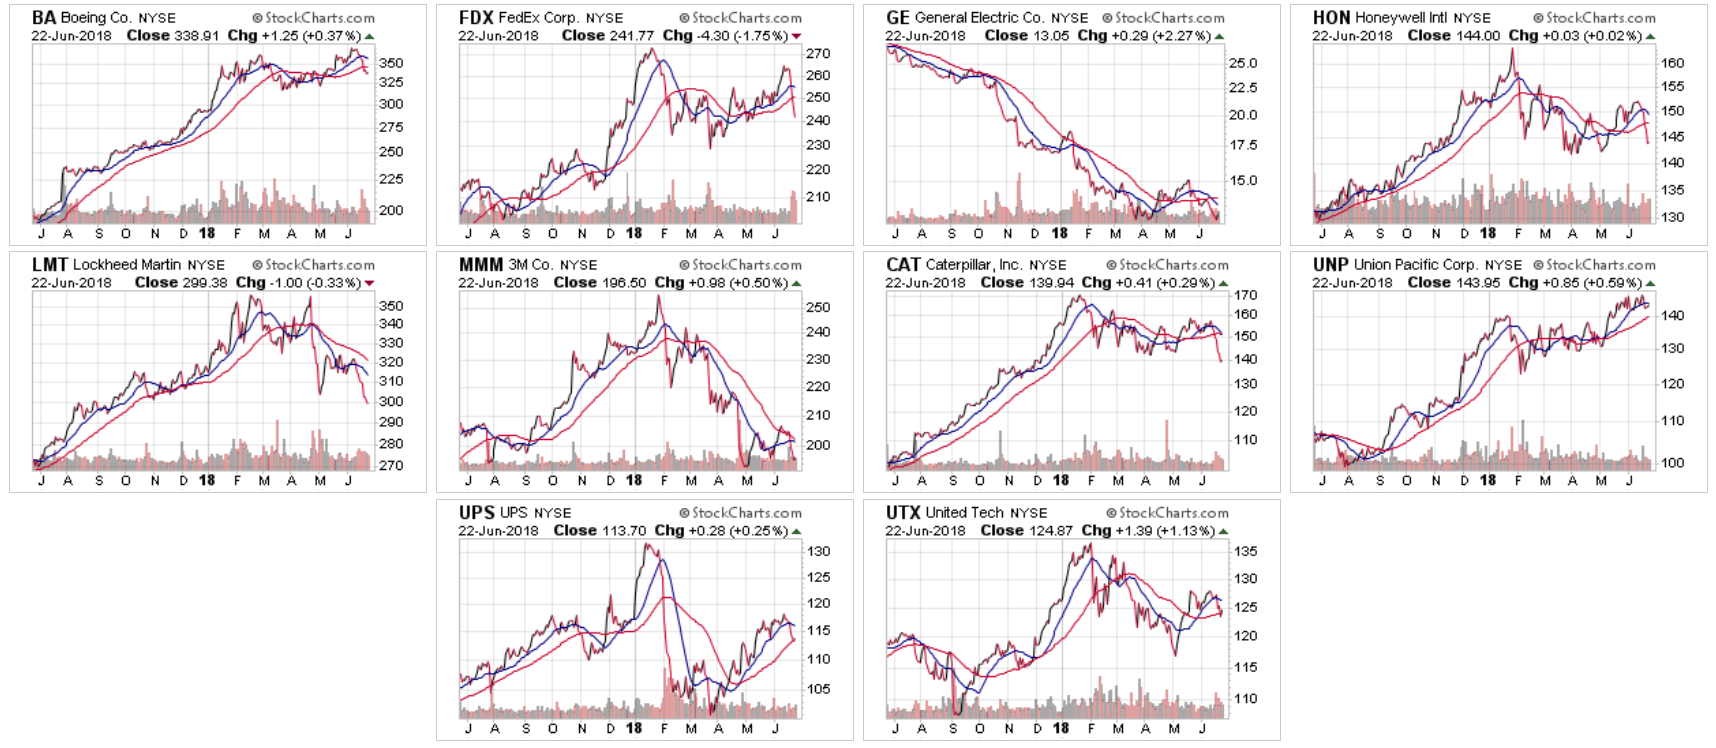
The charts of XLI's 10 largest members are uninspiring. Boeing (NYSE:BA) (top row, far left) has the best chart, followed by Union Pacific (NYSE:UNP) (middle row, far right). But the other members are either consolidating sideways or are in some kind of technical malaise. Two - 3M (NYSE:MMM) (second row, second from the left) and General Electric (NYSE:GE) (top row, second from the right) are at/near 52-week lows. Lockheed Martin (NYSE:LMT) (second row, far left) and Caterpillar (NYSE:CAT) (second row, second from right) both want to break to the downside. There is little upward momentum above.
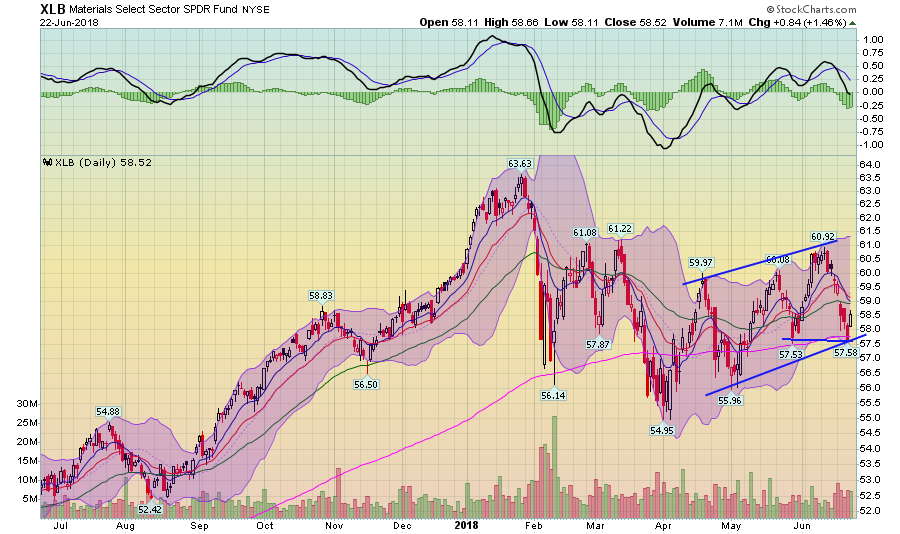
The basic materials sector's performance is similar:
This sector - like the industrials - is in a slight uptrend, using the 200-day EMA for technical support.
And the charts are also uninspiring:
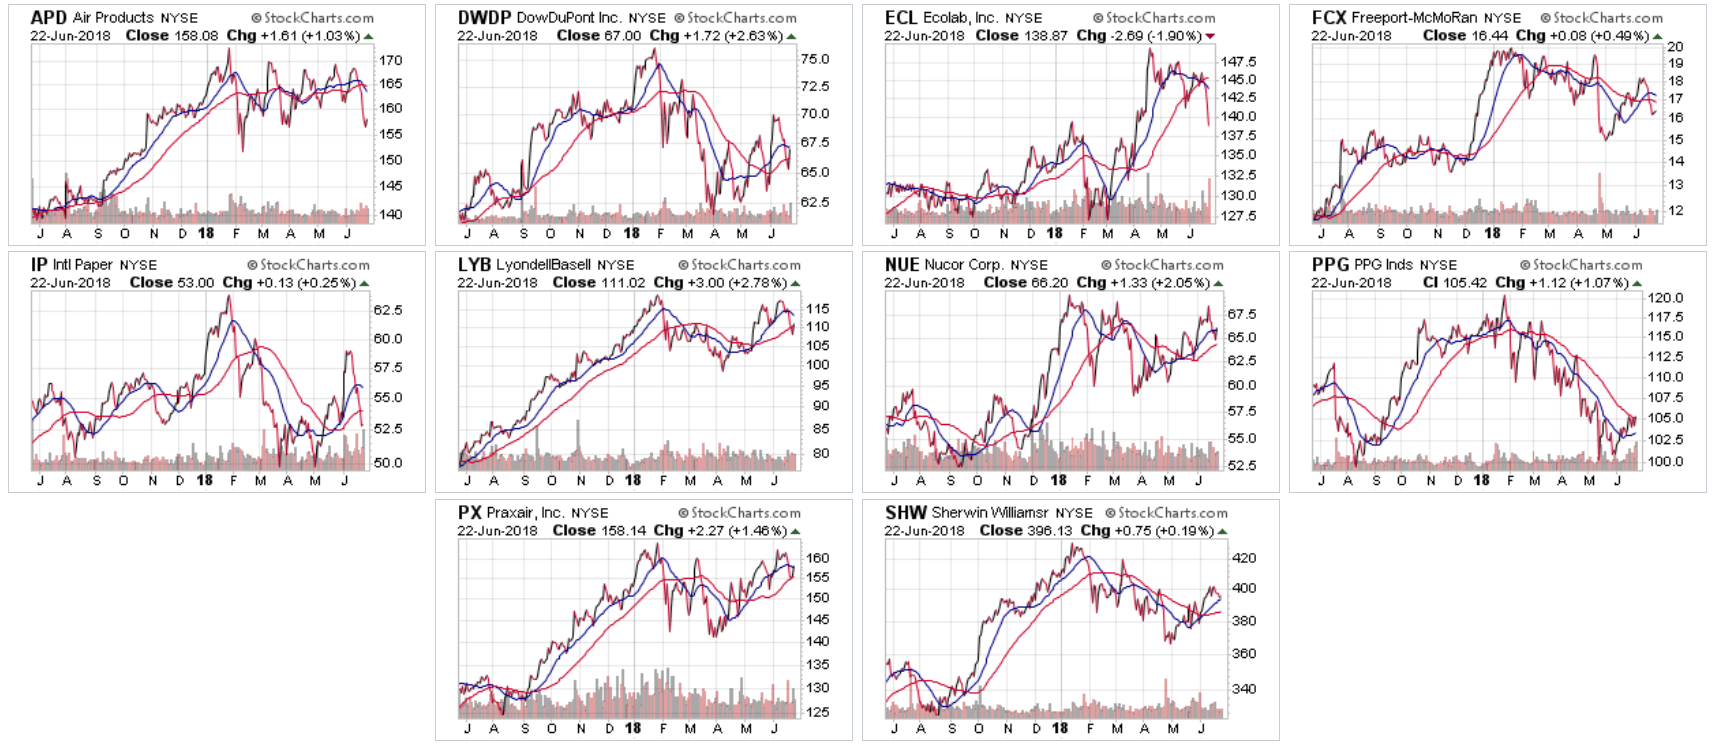
There are only two charts in a modest uptrend: LyondellBasell (NYSE:LYB) and Praxair (NYSE:PX). Everybody else is either moving sideways or is at/near 52-week lows.
We shouldn't be surprised to see the XLIs and XLBs underperform. While the data from the manufacturing sector has been very strong of late, the imposition of tariffs and these sectors' international exposure is enough to keep them underperforming for the foreseeable future.
Disclosure: I/we have no positions in any stocks mentioned, and no plans to initiate any positions within the next 72 hours.
I wrote this article myself, and it expresses my own opinions. I am not receiving compensation for it (other than from Seeking Alpha). I have no business relationship with any company whose stock is mentioned in this article.

