Sector ETF Week In Review For June 17-21Summary
- The overall orientation of the market remains bullish.
- Aggressive sectors outperformed last week, but defensive sectors remain stronger long-term.
- And over-allocation to defensive sectors continues to be warranted.
Investment thesis: While all sectors are enjoying a "rising tide lifting all boats" environment, defensive sectors (utilities, staples, and real estate) have better charts. Healthcare has joined this list during the June rally.
Let's begin with the weekly chart:

This is a good table for the bulls with all 10 sectors increasing. Energy led the way, thanks to increasing Middle East tensions. Technology - which comprises the largest percentage of SPY and QQQ- was the second-best performer. Industrials - another bullish sector - ranked number four. The only defensive sector in the top four is healthcare.

The one-month table is also bullish, with 9 of 10 sectors advancing. The top four positions are evenly split between aggressive and defensive sectors. The former is slightly outperforming the latter. A more dovish Fed is responsible for propelling basic materials to the number one position, while a waning of political issues are responsible for healthcare's number two position. Technology and utilities fill out the three and four spots. The other two defensive sectors (real estate and staples) are number six and seven on the table.

The three-month table is still defensive: staples, utilities, and healthcare occupy the top three positions.
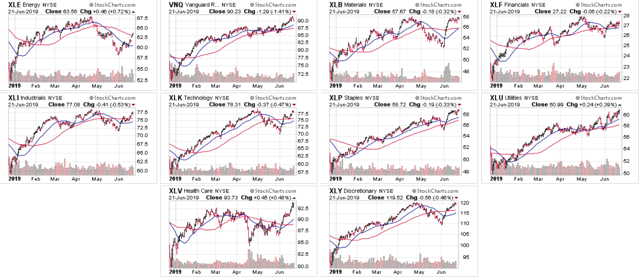
Let's next turn to the six-month charts:

I'll be reviewing them left to right, top to bottom:
- XLE: Energy sold-off with the broader market in late spring. It has caught a decent bid since the beginning of June. Prices are now just above the 50-day EMA. The chaotic situation in the Middle East is supporting this sector.
- VNQ: Real estate has one of the three best charts of the bunch. It consolidated in a narrow, 2-point range in April and May as traders started to speculate that the Fed would switch to a more dovish stance. Prices have advanced through resistance during June and are now just off one-year highs.
- XLB: Basic materials caught a strong bid at the beginning of June, thanks to a more dovish commentary (this sector is heavily dependent on financing for capital expenditures). Prices are currently near one-year highs.
- XLF: Financials have had a slight, upward trajectory over the last six months. While the rate cuts are negative for banks, XLF is comprised of other financials such as insurance companies and financial advisory firms - the latter of which benefits from the continued bull market. Add in the modest yield (1.95%) and you have sufficient fundamental support.
- XLI: Industrials have been moving more or less sideways. Large, international companies comprise this sector. They have been buffeted by the competing bullish and bearish trade headlines. On the plus side, these are companies that, due to their size, are better able to withstand a slowdown.
- XLK: Tech was the market darling until the spring sell-off. Now, it not only faces general economic headwinds, but also the increased specter of government intervention and regulation.
- XLP: Staples have one of the strongest charts above; it's been moving from the southwest to the northeast for the last six months.
- XLU: Utilities have the second best chart; they rallied in early spring, consolidated for a few months, and then continued to move higher.
- XLV: Healthcare has the worst chart above. For most of the spring, political headwinds kept this defensive sector from rallying. Democratic presidential candidates floated a number of ideas that would alter the current market structure, while Republicans complained about high prescription drug prices.
- XLY: Consumer discretionary's overall trajectory was similar to tech's. Here, the difference was the overall strength of the U.S. consumer. While retail sales spending dropped in early 2019, it has since rebounded.
So - what can we discern from the above information? The overall trend of the markets remains higher; with the exception of healthcare, all the charts have a general southwest-northeast orientation. But defensive sectors continue to have the best charts. When the broader market sold off in spring, utilities, staples, and real estate consolidated. Healthcare has since joined this list of companies.
