Let's start with the performance tables, beginning with last week's:

Last week, 8/10 sectors rallied, with technology, industrials, and consumer discretionary occupying slots 2-4. Defensive sectors are at the bottom; three (real estate, staples, and healthcare) were up modestly; utilities were down slightly.

Over the last month, financials, technology, and consumer discretionary were the top three performers with consumer staples and real estate rounding out the top five. As with the one-week chart, utilities and healthcare are in the bottom half.

Over the last three months, XLP was the top-performing sector, rising 6.76%. The next four positions are occupied by aggressive sectors - technology, basic materials, and financials.
Aggressive sectors are now leading defensive sectors across all time frames, as the following tables show:

This table shows that defensive sectors overall performance have moved down the list:

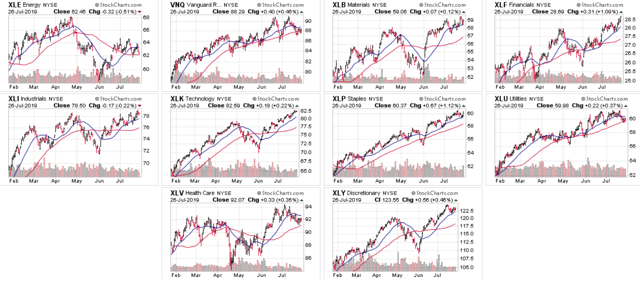
Let's place this data into perspective by looking at the six-month charts:

Despite their drop in overall performance relative to other sectors, defensive ETFs still have solid charts.
- VNQ (top row, second from left): The overall trend is still higher. The 20 and 50-day EMAs are rising and prices are using the 50-day EMA for technical support.
- XLP (middle row, second from right): The trend is clearly higher, with a solid SW-NE trend. Both EMAs are moving higher with prices using both for technical support.
- XLU (middle row, far right): Prices started an uptrend in mid-May; before that, they consolidated sideways.
- XLV: This is the only mixed chart: prices were in a modest downtrend through late May/early June before rallying.
The reason for the overperformance of aggressive sectors is that each has risen from a large Spring sell-off:
- XLB (top row, second from right) sold-off to 52 in late May but has rallied to 59 - a gain of 13.5%. This sector (along with the XLI) has been disproportionately impacted by trade take news.
- XLF (top row far right) has been in a modest uptrend since April, but over the last two months, it has rallied from 25.71 to 29 for a gain of 10.5%. It is also at a yearly high.
- Since the beginning of June, XLI (middle row, far left) has rallied from the lower to upper 70s, for a gain of slightly more than 10%. It's most recent peak was just shy of a yearly high.
- Consumer discretionary (lower row, right) has rallied nearly 15% over during the last two months.
The key time for all the aggressive sectors is early May. Before then, international news was bearish (which it still is) and the trade talks between the US and China started to break down. In early May, the Fed started to telegraph that it was changing from a hawkish to dovish tone. US economic news continued to show modest but consistent economic growth. And we recently learned that US-China trade talks were back on track to some degree. The combination led traders to bid-up aggressive stock sectors.
There's no reason to think this trend won't continue in the short-run. The initial read of 2Q GDP was "less bad," which provided a boost to the market last week. But, should the market determine the number was less than impressive, it can then argue that it gives the Fed ample reason to lower rates, allowing the short-term bull run to continue. While there is softness in some data (housing and manufacturing), PCE and retail sales data show that the US consumer is still spending, adding to the bulls' argument. This trend is likely to continue in the short run.
Summary
