Sector ETF Week In Review For July 15-19Summary
- Overall, the sectors performed poorly this week.
- Aggressive sectors outperformed on the monthly table, while defensive sectors were better performers on the three-month table.
- Defensive sectors have better daily charts; there is little in the shorter-term charts indicating a major rally is headed our way.
Investment thesis: The sector analysis indicates there is very little strength in the market overall. Defensive sectors have the strongest charts; there is little in the shorter time frames pointing towards a strong advance in the broader averages.
Let's start with this week's performance table:

8/10 industries were lower and the two industries that gained were just barely positive. That makes this pretty bearish table. There's a modestly defensive orientation to the top five entries, with staples, utilities, and healthcare occupying the 1st, 3rd, and 5th slots, respectively. The only defensive sector in the bottom half of the table is real estate.

The one-month table is far more bullish. Only one defensive sector (staples) is in the top four position. Utilities, healthcare, and real estate occupy the bottom three positions. One was unchanged, while the other two were down. 
The three-month chart has returned to a defensive orientation, with healthcare, utilities, and staples occupying the top three slots. Notice the size of the defensive sector gains relative to the other sectors. Finally, energy, once again, is down thanks to the relatively cheap price of oil.
Let's now turn to the charts to see if there are any meaningful trends. I'll start with the one-week, five-minute charts. Last week all the trends were weak. XLP (consumer staples) had the best chart:
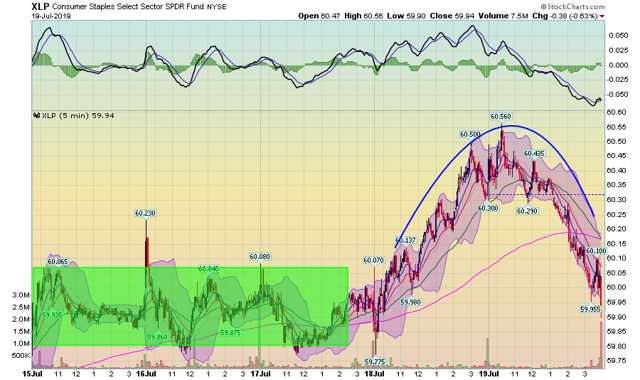
Prices traded in a sideways consolidation pattern Monday-Wednesday. That was followed by a rally on Thursday; the gains of which were mostly erased by Friday's trading. If this is the best chart, you know it was a bad week. 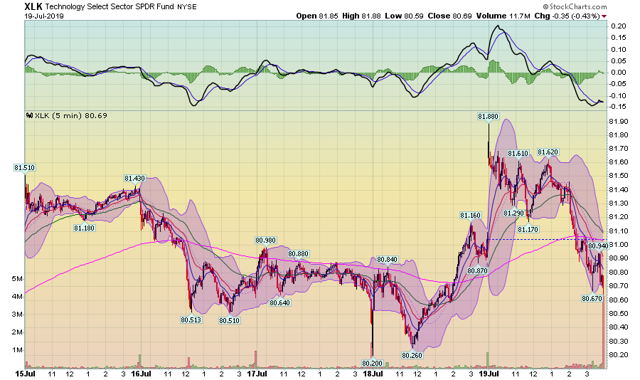
Technology was lower on the week. The chart trended lower Monday-Wednesday and then nearly did a complete round-trip trade on Thursday and Friday. Like the staples chart, there was a sharp increase in trading at the close. With the exception of the rally that started late Thursday afternoon, the overall trend is weak.
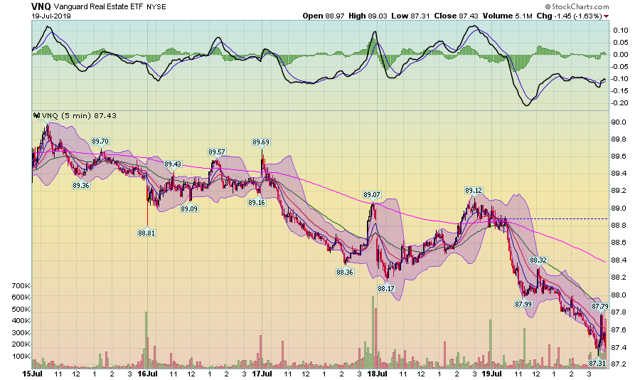
And then there's real estate, which trended lower for the entire week.
Pulling back to the two-week time frame, there are only two bullish charts:
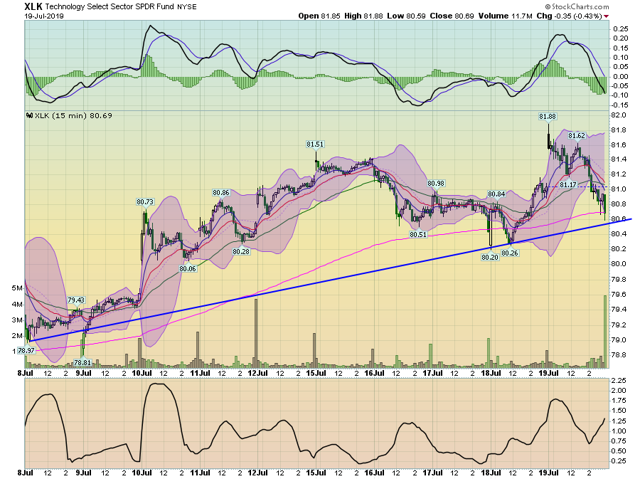
Technology is moving higher with a trend line connecting lows from July 8, 9, and 18.
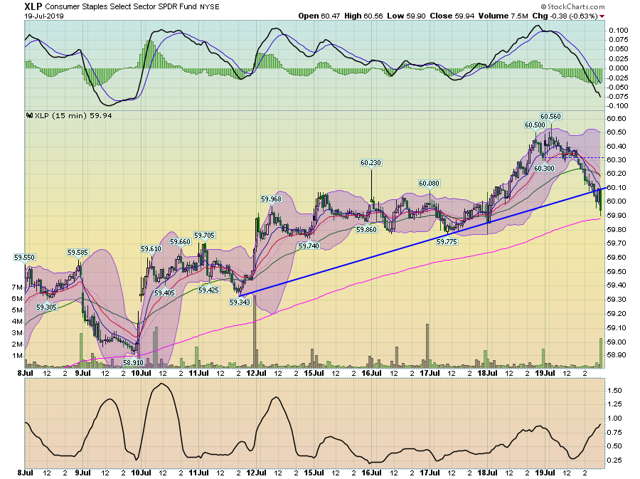
Staples are also in an uptrend (see the rising 200-minute EMA in pink), although on Friday afternoon prices broke a shorter trend line connecting lows from July 11, 17, and 18.
Other two-week charts are bearish:
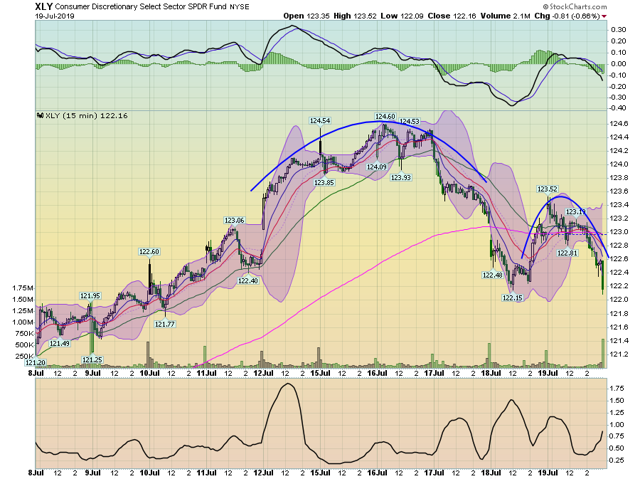
Consumer discretionary has formed two round top patterns: the first occurring between July 12 and July 17 and the second on Thursday and Friday of last week.
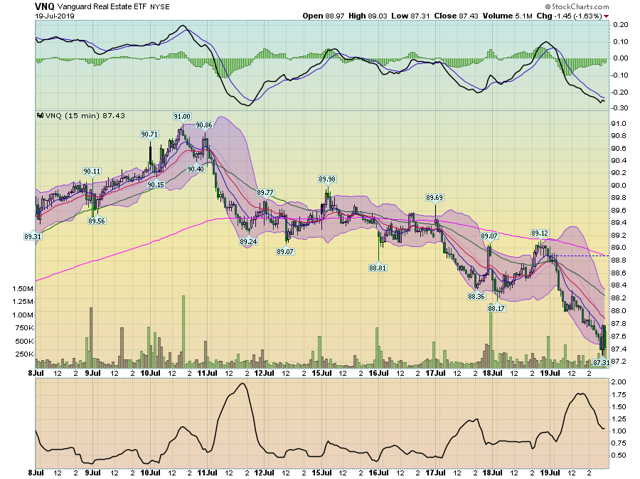
Real estate is in a solid downtrend for most of the two-week period, save for the three-day rally between July 8 and 10.
During the 30-day time frame, the bulls have slim pickings.
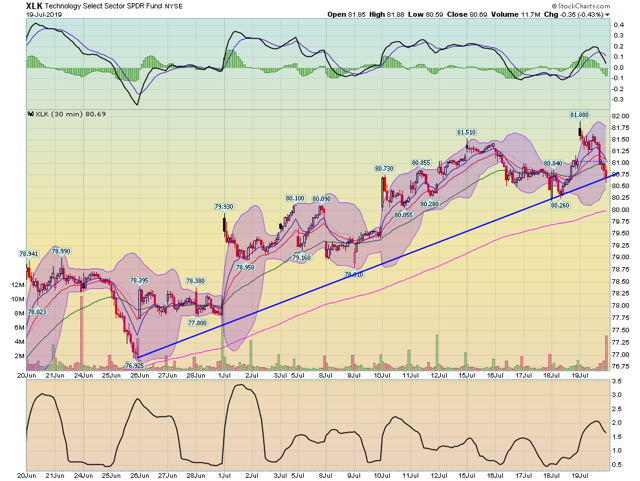
The only solid uptrend is on the XLK chart, with a trendline connecting the lows of June 26 and July 18.
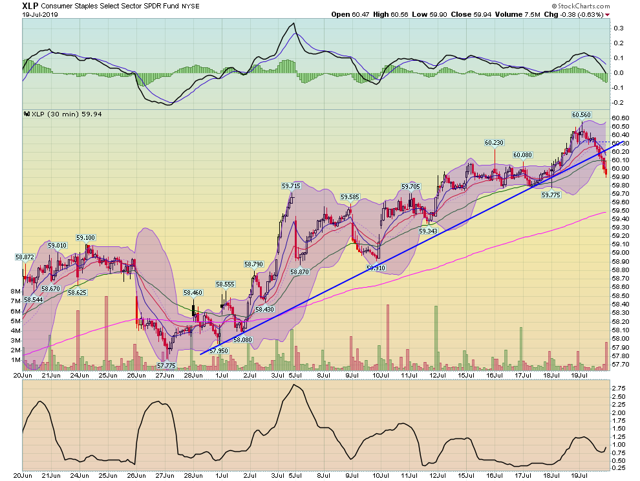
On Friday, the 30-day chart for staples broke a 15-day uptrend.
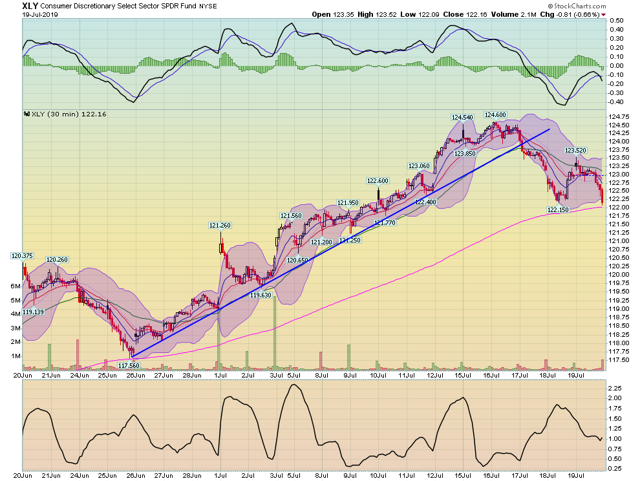
Consumer discretionary broke its uptrend earlier in the week. Prices are now at the 200-day EMA.
Finally, let's take a look at the daily charts, starting with technology:
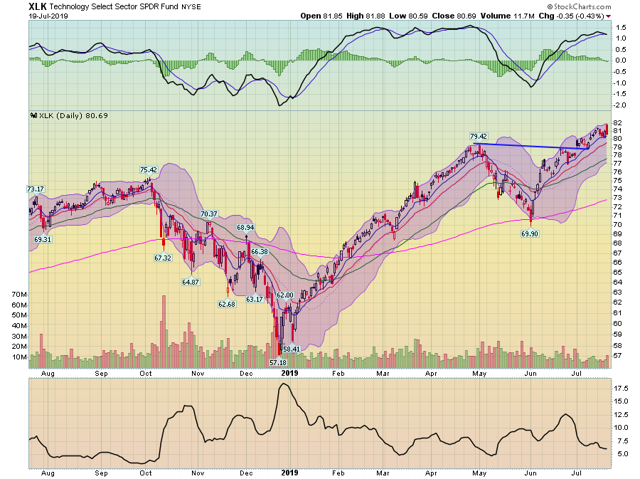
Prices broke through resistance at the 79.42 level in early July and have gained a few points since. But the MACD has given a sell signal.
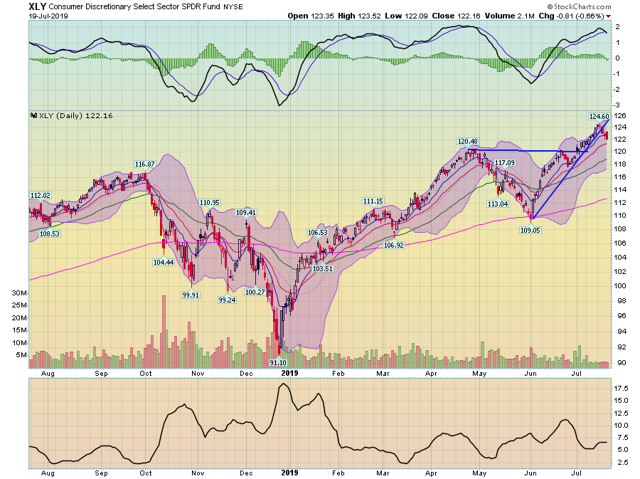
Consumer discretionary broke an uptrend this week while the MACD has also given a sell signal.
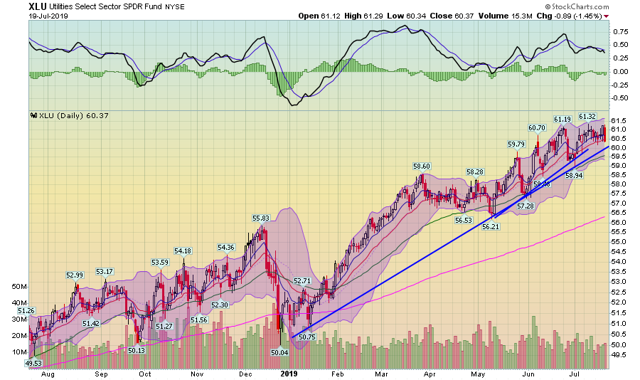
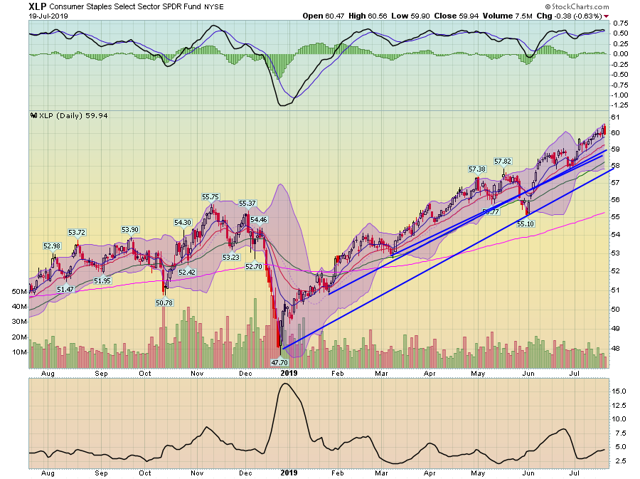
Two key sectors that indicate economic sentiment appear to be in a short-term top. Meanwhile, defensive sectors still have very bullish charts:
Both utilities (top chart) and staples (bottom chart) remain in solid uptrends that started at the end of last year.
There is little in the short-term charts indicating that a strong rally is on the way. Most charts are weak; defensive sectors - which comprise a small percentage of the market - are the strongest. The sector analysis argues for a more weakness in the broader averages.

