Summary
- The more defensive tone of the last few months has given way to a more bullish orientation.
- Several defensive sectors that were leading are now weaker.
- I look at the newly advancing sectors from a technical and fundamental perspective.
For the last 3-5 months, the sector rotation has been decidedly end-of-cycle, with the utility, healthcare, real estate, and consumer staples ETFs leading. That is now changing.
Let's start with last week's performance table:
The financial sector was the best performer, outpacing the number two sector by almost 100%. Zacks noted that, in general, this sector's recent earnings performance has outpaced analysts' expectations, which supports the move higher. Industrials benefitted from positive trade talk news/rumors. Oil has rebounded 28% from its recent sell-off, taking the energy ETF with it. Tech was the fourth-best performer. It's not until we get to the fifth spot on the list that we see a defensive sector - healthcare.
The one-month list is also more bullish:

Above, the top three sectors are the financials, energy, and consumer discretionary, which is (again) a decidedly bullish orientation. Defensive sectors (real estate, staples, and utilities) are the bottom three performers.
And on the three-month chart - where the defensive sectors have dominated for the last few months - we see a more bullish list. Real estate is at the top. But basic materials and consumer discretionary are two and three. Utilities and staples have been pushed down to numbers four and five.
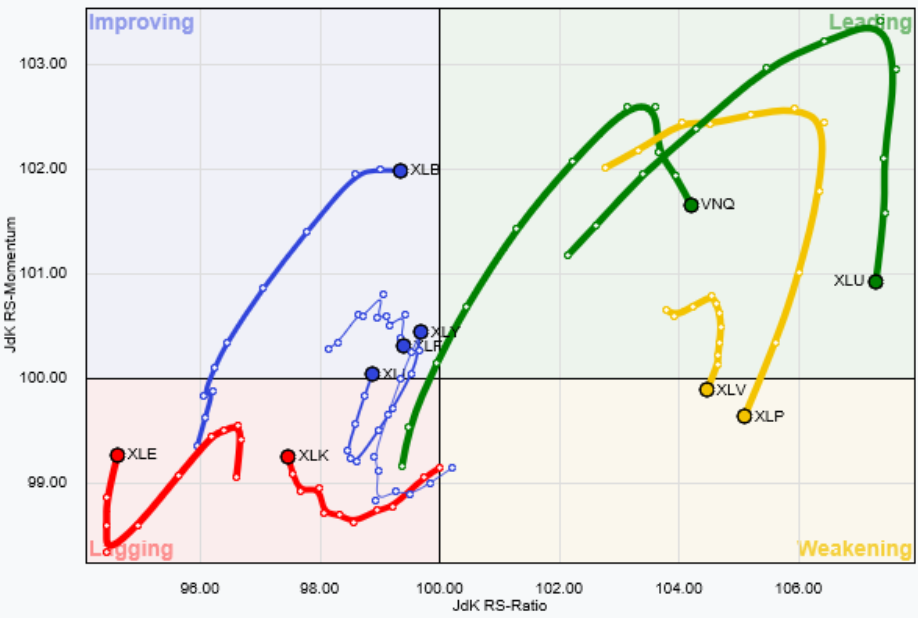
The relative strength graph places this into perspective:
Healthcare and staples are now weakening while real estate and utilities continue to move lower. Basic materials, discretionary, financials, and industrials are improving; discretionary and basic materials are very close to the leading panel.
Let's look at these four improving sectors in a bit more detail, starting with financials:
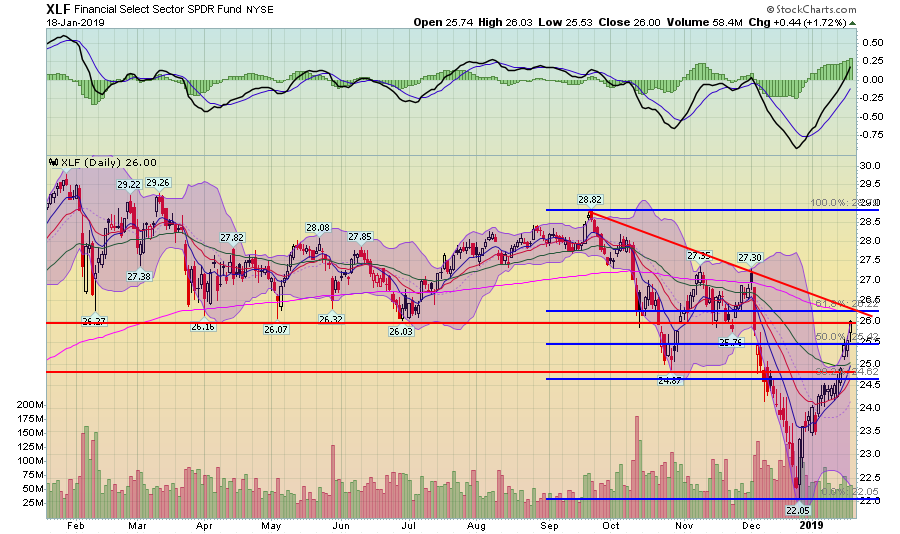
The financial sector dropped in the sell-off, falling 24%. The ETF has since rallied 18%. Prices have advanced through the 10-, 20-, and 50-day EMA and key resistance levels. Momentum is rising. Technically, the picture is positive.
Fundamentally, there is one key problem: the flattening yield curve, which compresses the interest rate margin, is a key source of profitability for banks. Banks, however, are not the only financial companies in this sector. It includes insurers and financial service firms. The former always has the specter of a poor claims year, while the latter currently has to deal with end-of-cycle issues.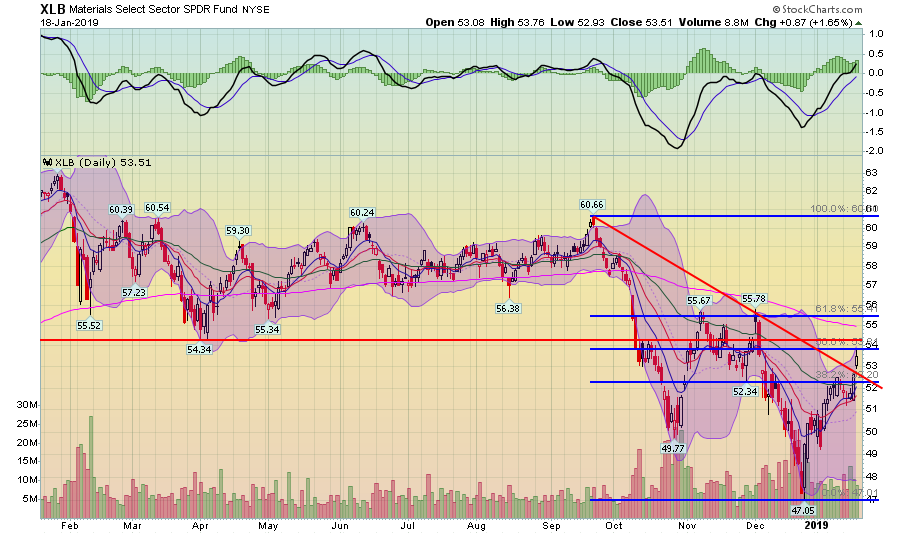
The basic materials sector also dropped in the recent sell-off, falling 22%. It has rebounded 14%. Prices have advanced through the 10-, 20-, and 50-day EMA as well as resistance that connects the highs from mid-September and late-November. Momentum is rising. This is a positive technical picture.
The fundamental backdrop is mixed. Commodity prices are weak, taking away the pricing power for these companies. Trade war issues are greatly complicating supply chains. And the economic cycle appears to be closer to the end than the beginning. But on the plus side, at the beginning of last year, it appeared the global economy was on track for synchronized growth. Assuming we can get through this period of uncertainty, that growth might reemerge.
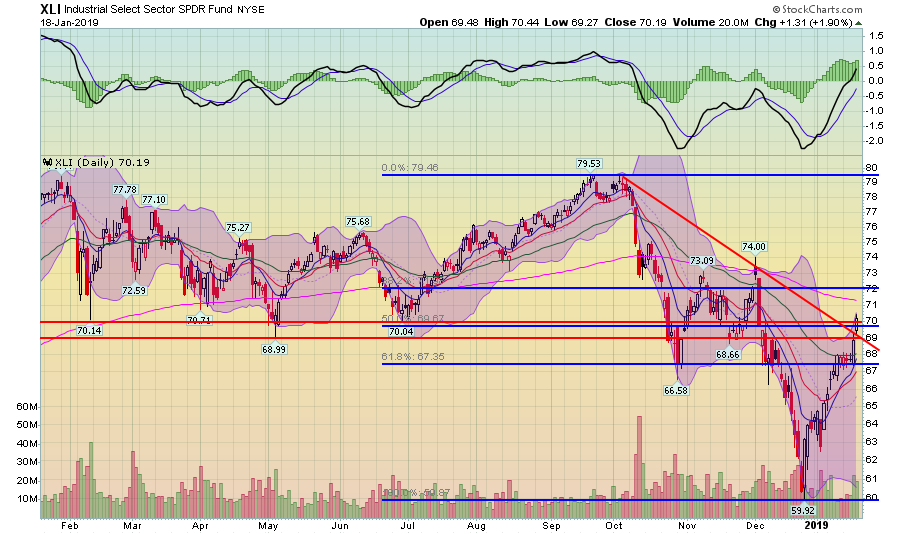
The industrial sector was caught in the sell-off, falling 25%. It has since rebounded 33%. Prices have advanced through the 10-, 20-, and 50-day EMA along with several key resistance levels. The shorter EMAs are rising as is momentum.
Most of these companies are large multi-nationals whose stock prices are likely to rise when there is good news on the trade front. A fair amount of the commentary for the basic materials sector applies to this sector as well.
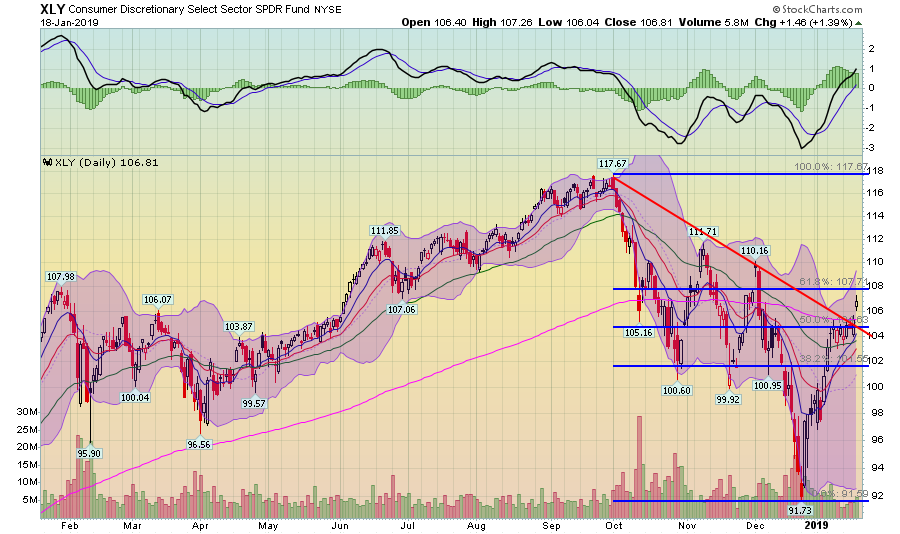
The discretionary sector fell with the rest of the market, dropping 22%. It has since risen 16%. Prices have advanced through all the EMAs. The 10 day-EMA has moved through the 50-day EMA; the 20-day will soon follow. Momentum is rising.
Most of the ingredients are in place for continued growth in this sector. Unemployment is low, and wages are rising. There is an upcoming potential weakness, as the University of Michigan's Future Expectations survey dropped 10% in the last report. But if the budget impasse is solved, that should rebound.
Technically, these sectors are attractive. The real question is will the fundamental picture support a longer-term advance.
Disclosure: I/we have no positions in any stocks mentioned, and no plans to initiate any positions within the next 72 hours. I wrote this article myself, and it expresses my own opinions. I am not receiving compensation for it (other than from Seeking Alpha). I have no business relationship with any company whose stock is mentioned in this article.


