Summary
- For the first time in a while, the weekly performance charts were positive.
- The longer-term performance table, however, remains defensive.
- I take a deeper look at the basic materials and financial ETFs and sectors.
Let's begin where we always do: the performance tables, starting with this week's table:

This is a very bullish orientation: Energy and discretionary are leading the pack, while defensive sectors are at the bottom. The best news above is all the green we're seeing, especially in ETFs like XLE (NYSE:XLE) and Consumer Discretionary Select Sector SPDR (NYSE:XLY) that have underperformed recently.
Here's the one-month table:
While there is no clear pattern between the bullish and bearish sectors, there is one clear result: red. Performance over the last month has been terrible with the best performing sector down 4.28% and the worst sector off nearly 8%.
Finally, we have the three-month table:
This is where a clear defensive orientation is clear: utilities, staples, real estate, and healthcare are the best performers while tech, industrials, and energy are at the bottom. We also see this orientation in the relative strength graph: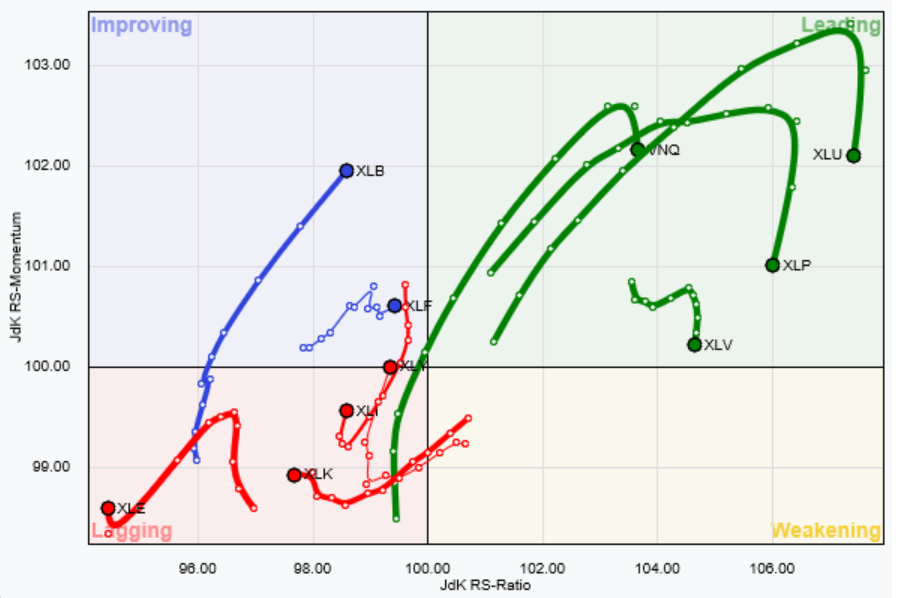
From stockcharts.com
Defensive sectors continue to hold court in the leading area of the table. But note all are losing strength (they're heading lower) and healthcare is near the line separating leading and weakening. Staples has been declining for the last three weeks, and utilities have taken a pretty sharp downturn as well. Oddly, XLB continues to strengthen relative to SPY, and the financial ETF is nearing a cross-over into the leading sector of the graph.
Since they're in the improving category, let's take a deeper look at XLBs and XLFs, starting with the former.
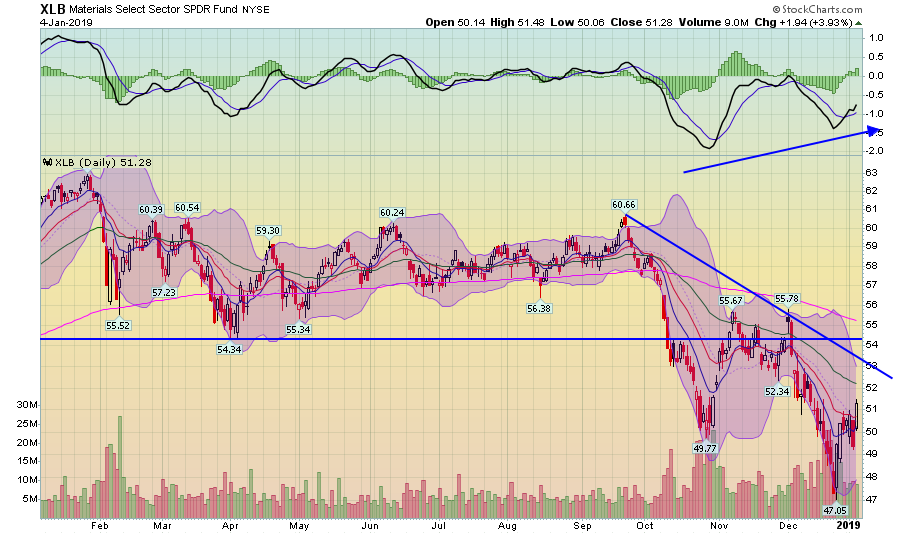
XLB was clobbered in the market's fall downturn, falling from 60.66 to 47.05 - an absolute decline of 22.5% - slightly further than the 20% bear market delineation. Recent developments are positive, however. While still negative, momentum is rising. It's possible the latest drop to 47 was a selling climax, as evidenced by the volume on the sell-off. Finally, the ETF has advanced slightly over 9% since the end of December.
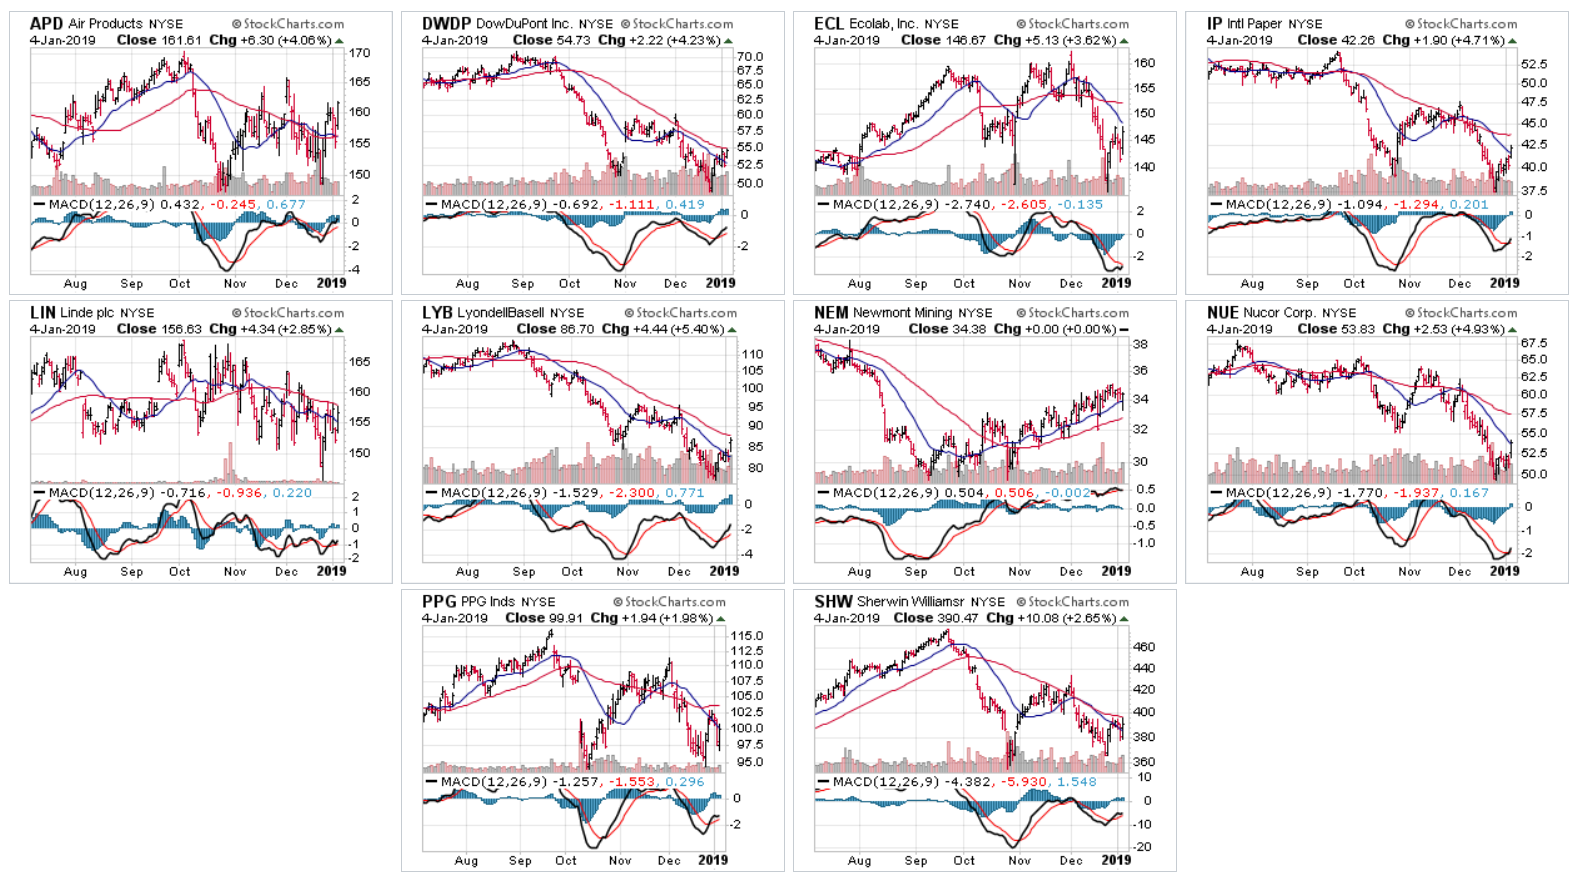
Here is a look at the charts of the 10 largest members:
There are four potential double-bottoms and an additional two charts could be considered as such. One chart is in a solid uptrend. Although momentum is negative on all the charts, it is rising. While not ideal, some of these charts could be setting up for additional gains.
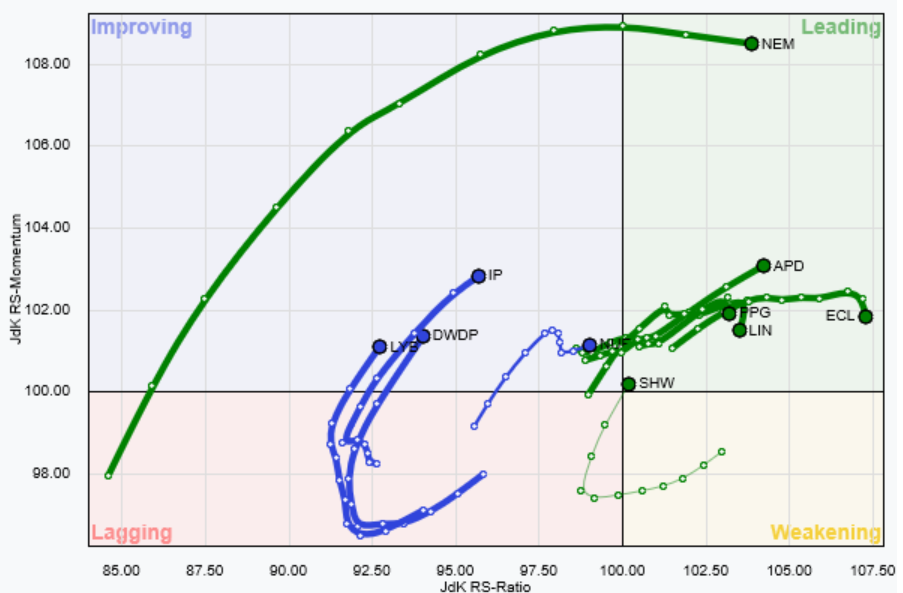
Six members are leading SPY and the other four are improving.
Next, let's look at the financial sector, starting with the daily chart:
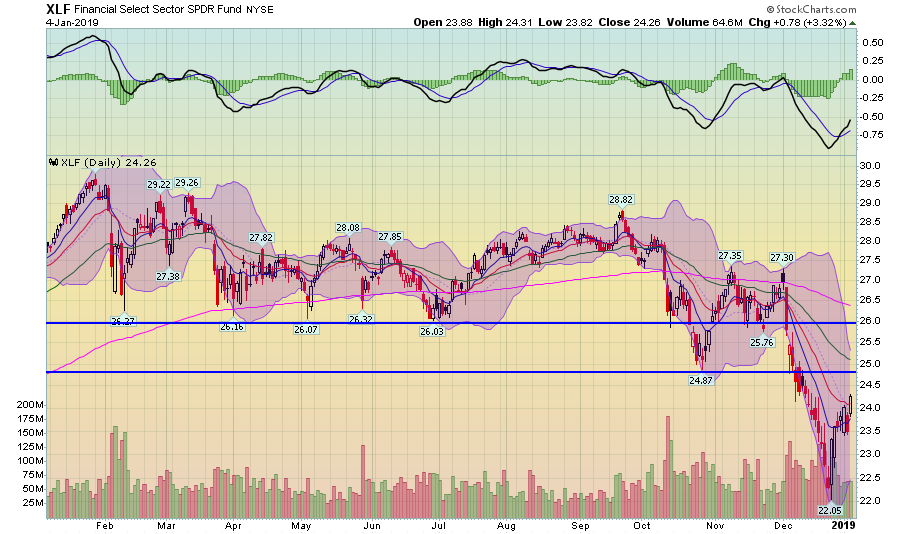
This is nearly a mirror image of XLB; recent developments are bullish, although the chart isn't yet at a true technical turnaround. The sector has fallen from 28.82 to 22.05 for an absolute decline of 23.5%.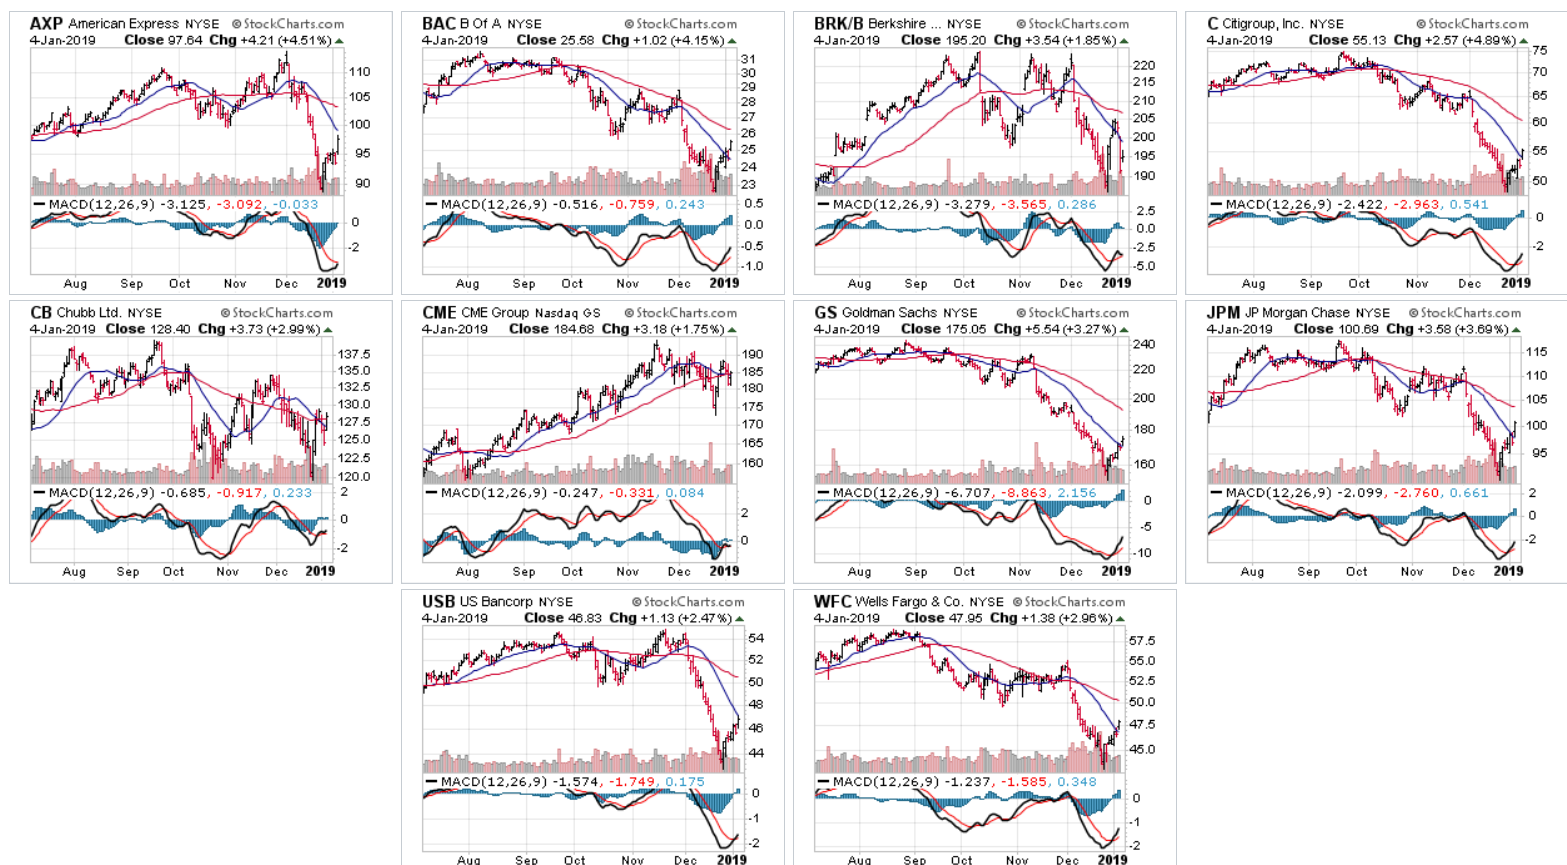
These charts are less bullish - at least, in their current form. Only one, CB, has printed a true turnaround pattern (a double bottom). A majority of the others are similar to the XLFs - a sharp sell-off, a potential bottom, and a rising MACD.
The RRG chart is very interesting:
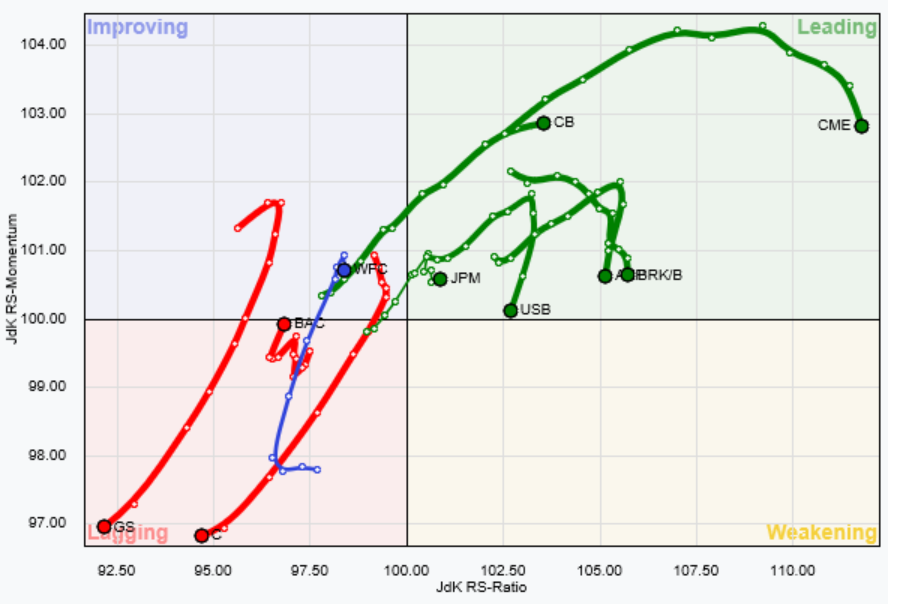
Goldman (NYSE:GS) and Citigroup (NYSE:C) (NYSE:C) are lagging badly. But six other companies are leading SPY.
In looking at the RRG charts, it's important to remember that "relative performance" doesn't mean rallying; it simply means "doing better than." And while some of the issues above are "doing better than" SPYs, they aren't necessarily the best issues to invest in right now. The basic materials sector is more dependent on international sales than other sectors, which means the current trade environment is less than supportive. The flattening yield curve will eventually translate into weaker back earnings. So, as we start the new year, be careful.
Disclosure: I/we have no positions in any stocks mentioned, and no plans to initiate any positions within the next 72 hours. I wrote this article myself, and it expresses my own opinions. I am not receiving compensation for it (other than from Seeking Alpha). I have no business relationship with any company whose stock is mentioned in this article.


