Investing.com’s stocks of the week
Summary
- Once again, the sector orientation is defensive on a 1-week, 1-month, and 3-month basis
- Defensive sectors are outperforming SPY (NYSE:SPY)
- Don't forget about other asset classes like bonds
- Let's start where we always do - the weekly performance table:

It should surprise no one that most sectors were lower last week. Financials led the way, followed by energy and real estate. Two defensive sectors - utilities and consumer staples - held the first and third spot, respectively. While most of XLV's (NYSE:XLV) largest members were down, JNJ (NYSE:JNJ) disproportionately impacted the sector, which explains why this traditionally defensive sector was the fourth-worst performer this week.
Next up, let's look at the performance of the sectors over the last month:

Four conservative sectors are at the top of the list. Utilities were up 4.26%. Real estate was up marginally. The other two defensive sectors were modestly lower. At the bottom of the list are financials, industrials, and energy.
Finally, we have the three-month performance table:

Again, we have a defensive orientation. Utilities were the only real gainer, rising 5.65. Staples were up fractionally. Real estate was off modestly; healthcare was down (again, remember the JNJ effect). Thanks to weak oil prices, energy is off the most. Industrials and financials rounded out the worst performers.
The relative performance continues to favor defensive sectors:
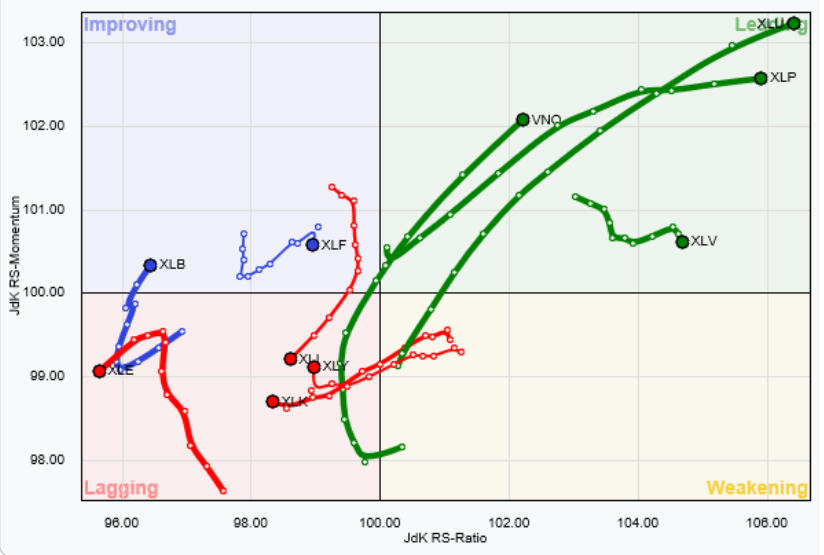
The defensive sectors continue to outperform SPY. While financials and basic materials are "improving," neither sector is poised for solid runs right now.
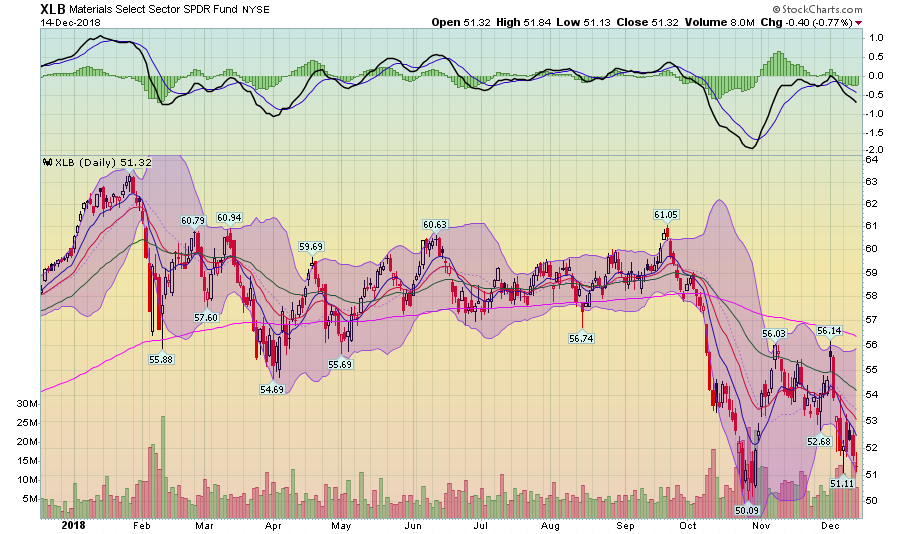
After selling off with the broader market this fall, the basic materials sector is now near a 52-week low. All the EMAs are moving lower with the shorter below the longer. Prices are below all the EMAs, which will keep pulling the averages down. Momentum is negative.
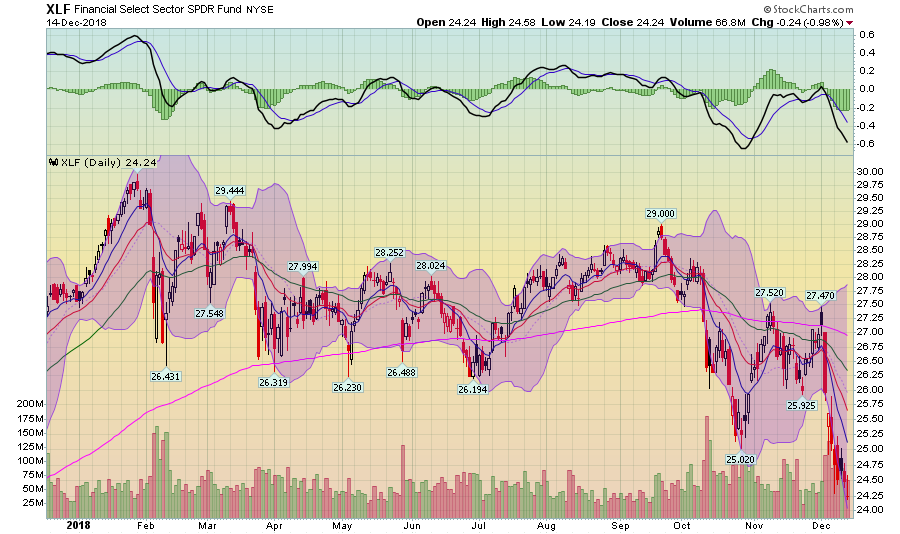
Financials are near a 52-week low. Like XLB (NYSE:XLB), the chart technicals are bearish: shorter EMAs are below the longer with prices poised to pull them lower; broadening Bollinger Bands® signal higher volatility; and momentum is weak and moving lower.
So, the two industries that might show potential are only "improving" because they're doing less badly than SPY. But the daily charts of both sectors are very bearish.
But looking at the 6-month charts of all the sectors, we see a near-universal bearishness: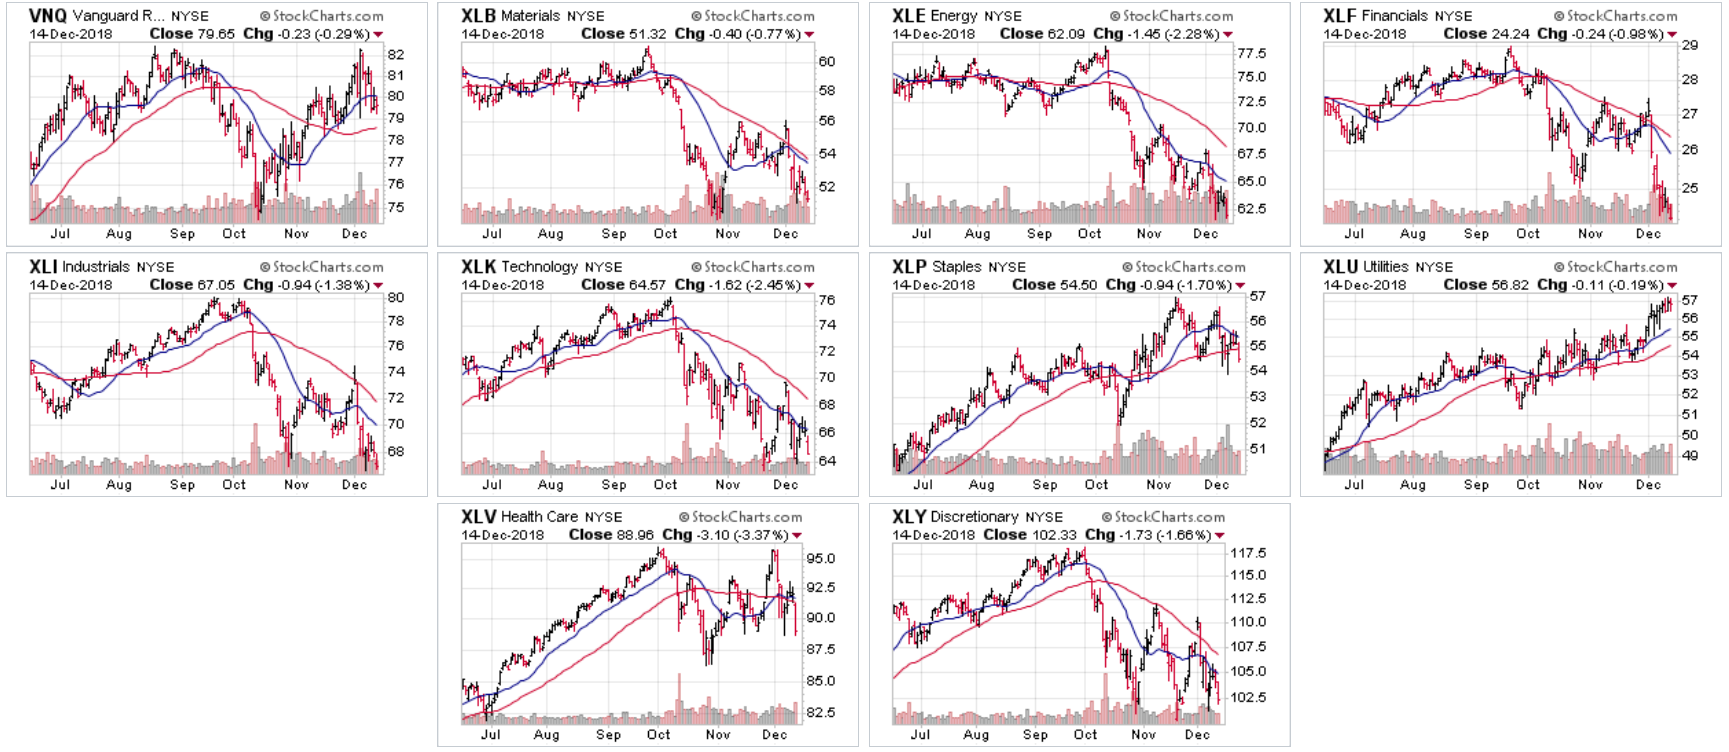
- Real estate (top row, far left) is in the top third of its chart and is in the middle of a 2-month rally. It's benefitting from high yields and a belief that we're nearing the end of the Fed's tightening cycle.
- Basic materials (top row, second from left) (see above for technical analysis). Fundamentally, this industry relies on international trade, which means increasing trade tensions are a key factor hurting the industry. In addition, a slowing global trade environment is also a net negative.
- Energy (top row, second from right). Oil is now in a bear market. Adding to the problems, the IEA recently noted that global growth (and therefore oil demand) will be weaker in 2019, further hampering the industry.
- Financials (top row, far right): a flattening yield curve is hurting the industry. In addition, weaker growth decreases loan demand.
- Industrials (middle row, far left): This industry is comprised of large, multi-national companies that rely on international trade and global growth, meaning they're on the negative receiving end of the global trade war.
- Technology (middle row, second from left): The FAANG stocks - which drove this sector higher for the majority of this expansion - are now correcting for various reasons. The global trade war issues are also hurting as is the possibility of increased regulation.
- Consumer staples (middle row, second from right): a defensive sector that is currently consolidating gains.
- Utilities (middle row, right): a defensive sector that is currently in an upward sloping rally.
- Healthcare (bottom left): Healthcare is comprised of truly conservative companies (drug companies), wholesalers, and financial companies (health insurers). The more conservative companies are doing well; the others are mixed.
- Consumer discretionary (bottom right): assuming we're at the end of the expansion, we can expect consumers to start pulling back from spending.
So what's an investor to do in this environment? First, getting defensive is entirely appropriate. Stick with healthcare, utilities, and consumer staples. Also, don't forget other assets classes. At the end of an economic cycle, bonds typically outperform stocks, which we're seeing right now: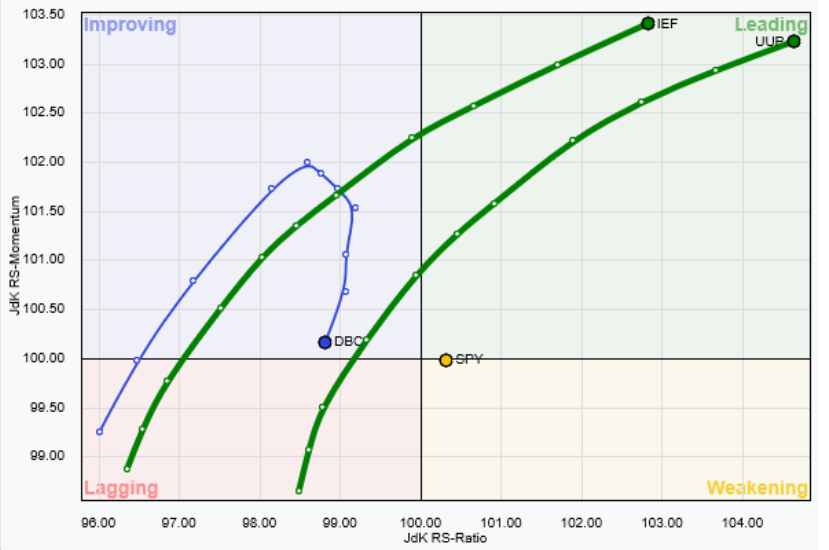
IEF (NASDAQ:IEF)(the 7-10 year Treasury) is leading SPY. Finally, don't forget cash. Remember that shorter-dated bonds are now providing modestly decent yields, relatively speaking.
Disclosure: I/we have no positions in any stocks mentioned, and no plans to initiate any positions within the next 72 hours. I wrote this article myself, and it expresses my own opinions. I am not receiving compensation for it (other than from Seeking Alpha). I have no business relationship with any company whose stock is mentioned in this article.
