Summary
- The performance tables are skewing more and more conservative.
- Energy has underperformed.
- With the right fundamental catalyst, energy could outperform in the coming weeks/months.
As always, let's start with the weekly performance tables:
This is a very defensive table: staples, utilities, and healthcare led the pack. Industrial Select Sector SPDR (NYSE:XLI) bounced back a bit; news that a resolution to the trade spat might be happening helped to boost the sector. Technology Select Sector SPDR (NYSE:XLK) - which had led the market for most of the last year or so - barely rose. Energy sold off with the oil market. Remember this occurred in the context of the broader market rally this week approaching 52-week highs.
The 1-month table has the same pattern: it is led by healthcare, utilities, and staples. The Financial Select Sector SPDR (NYSE:XLF) ETF is the fifth best performing sector. This only occurred because the sector had a great second-quarter earnings season. With the yield curve flattening, that won't last. And energy is again at the bottom.
And finally, we have the three-month chart. Notice a pattern? Defensive sectors are once again the top three performers. Because this has occurred in three different time frames, we can now say that the market is taking a very defensive posture. This is a typical, late-cycle pattern, so it shouldn't be surprising.
But we can conclude two things from this development. First, traders think we're late in the market cycle and are trading accordingly. Second, it will be harder for the market overall to make new highs. Combined, these three sectors account for a little under 25% of the SPY (NYSE:SPY) sector composition. Compare that to the technology's weighting, which alone is 26%.
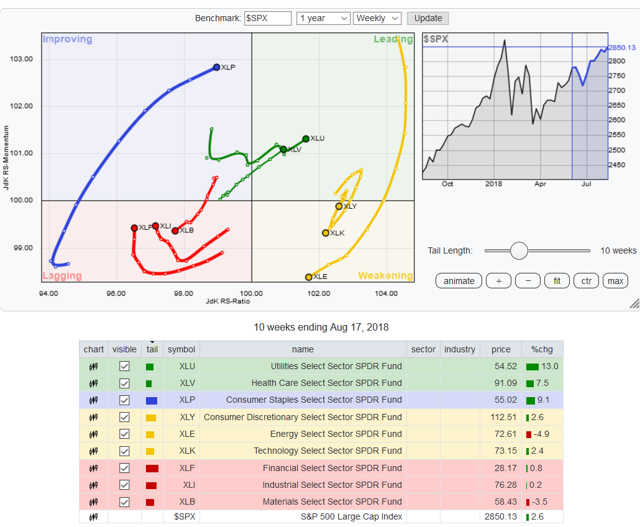
Let's place this information into context by looking at the sector rotation graph:
Utilities Select Sector SPDR (NYSE:XLU) and Health Care Select Sector SPDR (NYSE:XLV) are leading the SPY. Staples are improving. Despite a great retail sales report this week, Consumer Discretionary Select Sector SPDR (NYSE:XLY) is weakening, as is tech and energy. Industrials and basic materials are lagging thanks to trade war issues. Financials are down as well.
It's here that I look in more detail at a specific sector. This week, I want to put a spotlight on the energy market for the following reasons:
1.) It's underperforming in multiple time frames. It was the laggard in the weekly, monthly, and three-month time frames. That means there could be some undervalued or overlooked issues in the sector.
2.) Iran sanctions started at the beginning of August. And that could lead to issues with oil prices:
"August is never calm," said Michael Cohen, Barclays head of energy commodities research. "Summer in the Middle East, you just never know what could happen."
Iran's Foreign Ministry on Tuesday said the country would implement countermeasures if the U.S. attempts to block Iranian oil exports. That followed a weekend war of words between Trump and Iranian President Hassan Rouhani, who started the back-and-forth by cautioning the U.S. about pursuing hostile policies against Tehran.
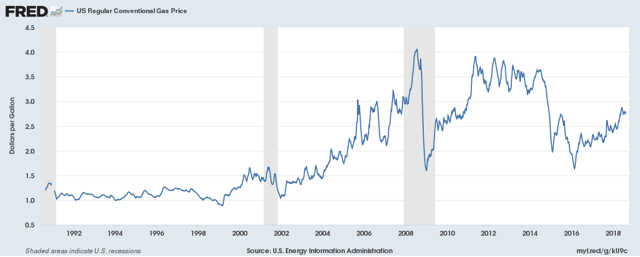
3.) Gas prices in the US are creeping higher:
At the national level, prices are about $2.75. Once they hit $3/gallon, we can expect negative news stories to hit. But these will be positive for the energy sector.
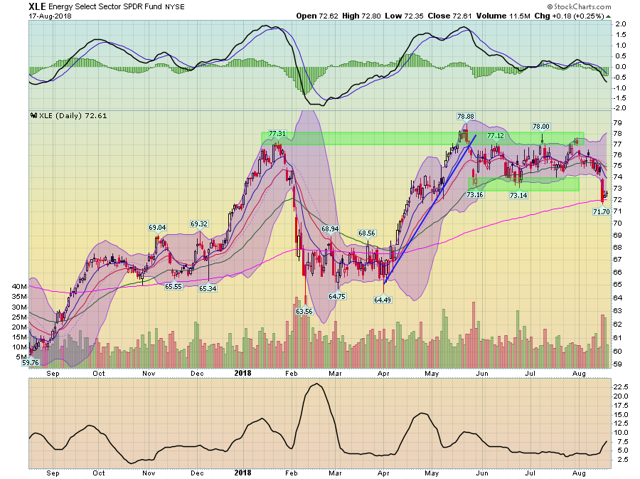
So, let's start by looking at the energy ETF:
Prices dropped to the 200-day EMA this week on heavy volume. Momentum dropped a bit. This development breaks their overall trend of trading between the lower and upper 70s, where they had been trading since late May. The key issue now is what happens with this ETF's price over the next few weeks. The 200-day EMA is a great place to hold technically; it's not uncommon for prices to hold this technical level for days, weeks, or even months. This is definitely something to keep an eye on.
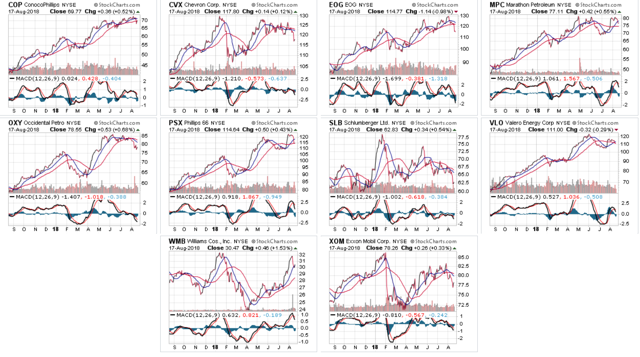
Let's look at the yearly chart of XLE (NYSE:XLE) ten largest members:
This collection of charts is not what I was expecting when I decided to focus on this sector. I was expecting a group of charts that were at least in the lower half of their 52-week trading ranges. However, we actually have a very good collection of charts. Seven are at/near their 52-week highs. With the right impetus (such as a spike in oil prices), they could easily move to new 52-week highs, which should garner news focus. Only one stock, Schlumberger NV (NYSE:SLB) (second row, second from right) is near a 52-week low. Exxon (NYSE:XOM) (bottom row, right side) is also in the lower half of its 52-week range. But those are the only two stocks with a decidedly bearish orientation.
The bottom line? Put some of these companies on your radar screen and wait for a fundamental catalyst.
Disclosure:I/we have no positions in any stocks mentioned, and no plans to initiate any positions within the next 72 hours.
I wrote this article myself, and it expresses my own opinions. I am not receiving compensation for it (other than from Seeking Alpha). I have no business relationship with any company whose stock is mentioned in this article.


