Summary
What a difference a week makes. Towards the end of July, the sector orientation had become more bullish, with aggressive sectors outperforming defensive industries in multiple time frames. This week's sell-off - the largest of the year - returned the sector performance tables to a more defensive position.
Let's start with this week's table:


Last week was a bloodbath. Eight out of 10 sectors dropped with technology (-4.29%) and consumer discretionary (-4.41%) occupying the 9 and 10 spots. But industrials (-3.41%) were number 7 -- not exactly a high flyer. Defensive sectors were in the top 4 positions with two (real estate and utilities) up modestly on the week. Note the size of the sell-offs; five sectors were down over 3% while a sixth (basic materials) just missed that amount.
The one-month table is also bearish with eight of 10 sectors lower. Once again, defensive sectors are taking the lead with staples (+.51%), real estate (+.50%), and utilities (-.23%) occupying the top three spots. Thanks to oil's weakness, the energy sector is 10th. Technology is 4th (-.55%) and consumer discretionary (-2%) is 6th.

While six of 10 sectors were higher in the three-month period, the tone of the table is still bearish. The top three sectors (staples, utilities, and real estate) are defensive. And their gains (up between 3.74%-4.74%) are strong relative to the bullish sectors (basic materials rose 2.77%; technology advanced 1.57%). Industrials and energy occupy the 9th and 10th spots.
Last week, there was a near-universal breakdown across all the daily charts of aggressive sectors, indicating the market is turning more bearish. Let's start with technology.
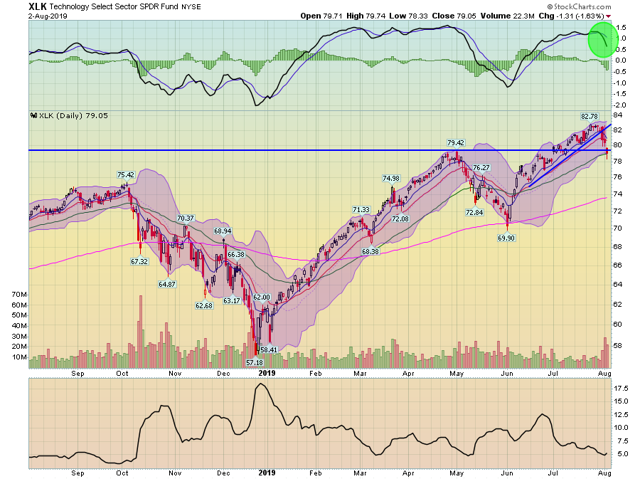
Technology comprises over 40% of PowerShares QQQ (NASDAQ:QQQ) and 20% of SPDR S&P 500 (NYSE:SPY) (NYSEARCA:SPY), making it the most important sector. Last week, prices broke an uptrend that started in early June and fell through support from late April/early May. Prices fell through the 10- and 20-day EMA, eventually resting on the 50-day EMA. Volume was noticeably higher.
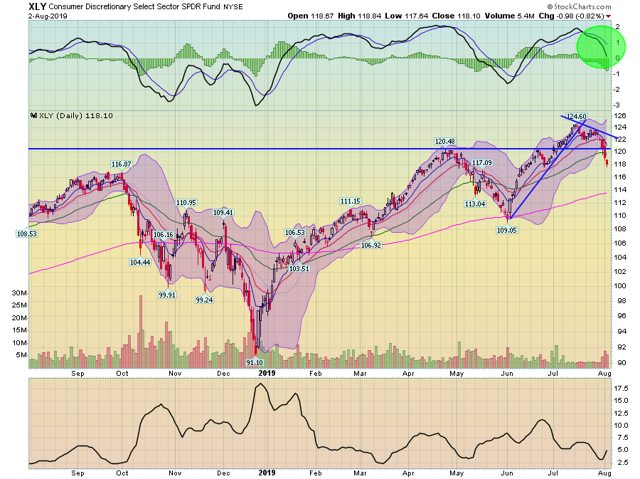
The consumer discretionary sector's (NYSEARCA:XLY) performance shows us how traders view the US consumer's prospects. Prices started to trend lower in mid-July. Last week, they fell through the 10-, 20-, and 50-day EMA, while also breaching support established in late April. Volume was noticeably higher as momentum reversed.
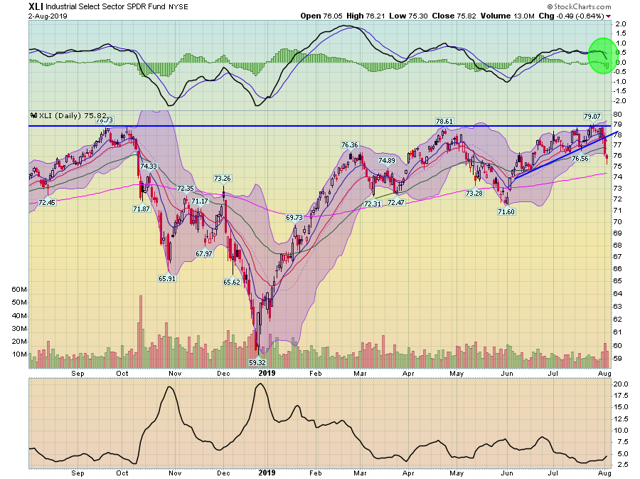
Industrials (NYSEARCA:XLI) are a good proxy for traders sentiment regarding the business sector. For the last year, prices have hit resistance in the upper 70s - a price level the chart was approaching throughout the summer. Last week, prices broke a two-month uptrend while also falling through the 10-, 20-, and 50-day EMA. They did this on higher volume while also reversing momentum.
Let's now turn to the defensive sectors.
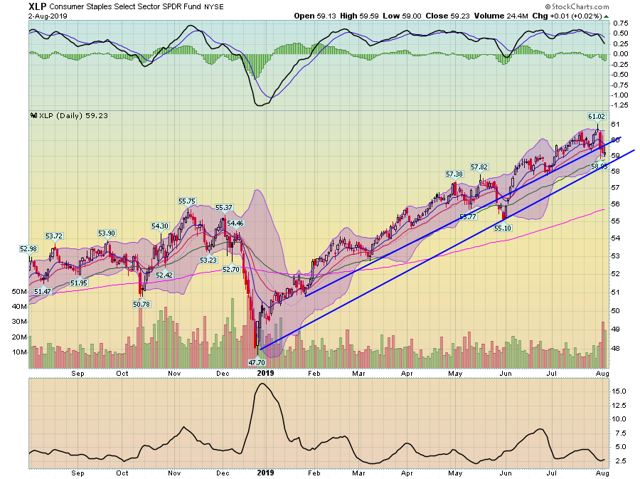
The staples ETF (NYSEARCA:XLP) has the worst defensive chart (which is a relative term). Prices broke a longer-standing uptrend last week on higher volume. Prices fell through the 10 and 20-day EMA while momentum gave a sell signal. However, the longest uptrend that started at the end of 2018 is still intact.
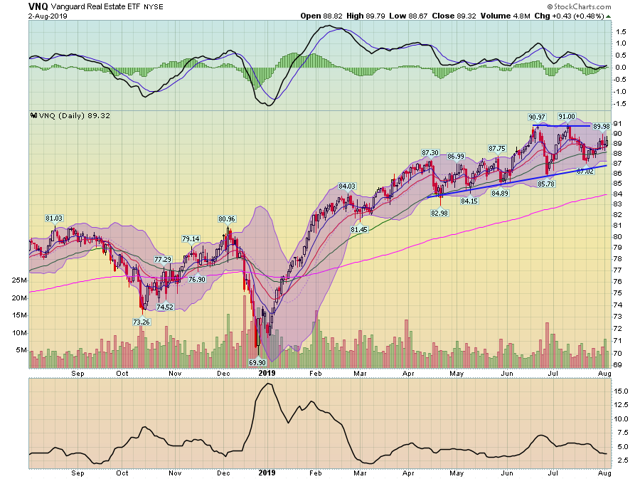
Real estate (NYSEARCA:VNQ) is still consolidating in a triangle pattern. There was no meaningful sell-off last week.
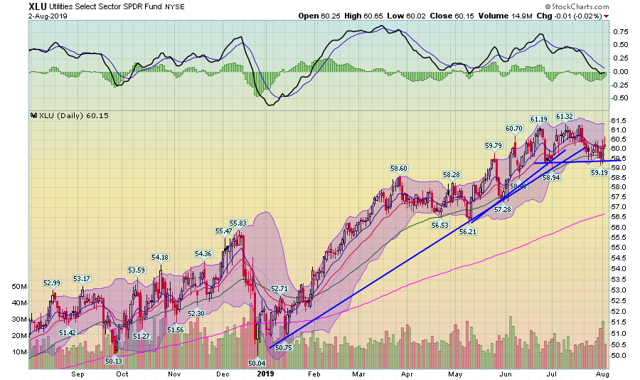
Utilities (NYSEARCA:XLU) dipped a bit but found support in the upper 50s. While volume increased on the sell-off, it wasn't enough to send prices through support.
As I noted in my weekly column, I'm now short and long-term bearish about the major averages. Last week's sector action merely reinforces that analysis. With trend breaks across the aggressive sectors and defensive sectors technically holding up, we now know that traders have "voted with their pocketbooks" about the next month or so of economic news. And that vote says the economy is slowing, making defensive sectors more attractive.
