It has been pretty well documented that certain days of the month have been better than others for the U.S. stock market. As it turns out, this may not just be an “American Thing.”
Country ETFs
In March 1996 17 iShares single country stock index ETFs began trading. The tickers are listed below.
iShares MSCI Australia (NYSE:EWA)
iShares MSCI Austria Capped (NYSE:EWO)
iShares MSCI Belgium Capped (NYSE:EWK)
iShares MSCI Canada (NYSE:EWC)
iShares MSCI France (NYSE:EWQ)
iShares MSCI Germany (NYSE:EWG)
iShares MSCI Hong Kong (NYSE:EWH)
iShares MSCI Italy Capped (NYSE:EWI)
iShares MSCI Japan (NYSE:EWJ)
iShares MSCI Malaysia (NYSE:EWM)
iShares MSCI Mexico Capped (NYSE:EWW)
iShares MSCI Netherlands (NYSE:EWN)
iShares MSCI Singapore Capped (NYSE:EWS)
iShares MSCI Spain Capped (NYSE:EWP)
iShares MSCI Sweden Capped (NYSE:EWD)
iShares MSCI Switzerland Capped (NYSE:EWL)
iShares MSCI United Kingdom (NYSE:EWU)
The Test
Buy and hold in equal dollar amounts all of the ETFs listed above only during the following days each month starting in 1996:
*The 1st 2 trading days of the month
*Trading days #9 through 13
*The last 4 trading days of the month
*While out of the market we will assume interest is earned at a rate of 1% annually.
We will compare this test to the results achieved by buying and holding all of the ETFs listed above with an annual rebalancing at the end of each year.
The Results
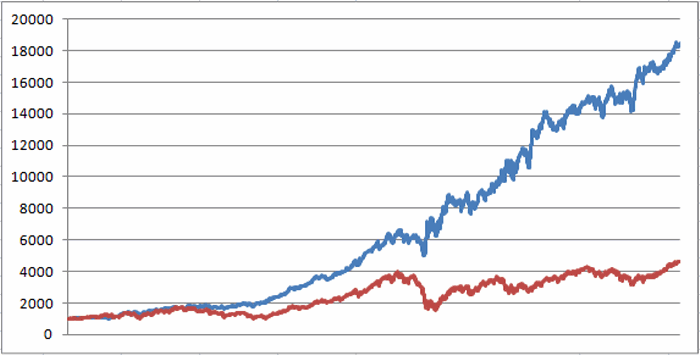
Figure 1 displays the growth of $1,000 invested in our “Seasonal System” (blue) versus $1,000 invested on a buy-and-hold basis with an annual rebalance (red).

Figure 1 – Growth of $1,000 invested using “Seasonal Single Country System” (blue) versus “Buy-and-Hold” (red); 3/29/1996-9/29/2017
Things to note:
| Measure | System | Buy/Hold |
| Average | 15.3 | 9.2 |
| Median | 13.4 | 11.2 |
| Std. Deviation | 12.4 | 21.3 |
| Ave/SD | 1.2 | 0.4 |
| Worst 12 Mos.% | (21.3) | (56.6) |
| Max. Drawdown % | (24.9) | (62.2) |
Figure 2 – “Seasonal System” versus “Buy/Hold”
Note in Figure 2 that the “System” generates a higher rate of return (+15.3% versus +9.2%) with a significantly lower annual standard deviation (12.5% versus 21.3%) and much lower (though not small) maximum drawdown of -24.9% versus -62.2% for “Buy/Hold”.
Other things to note:
*Overall the “System” gained +1,746% while Buy/Hold gained +363%.
*The “System” showed a 12-month gain 92% of the time and a 12-month loss 8% of the time
*”Buy/Hold” showed a gain 66% of the time and a 12-month loss 34% of the time.
*The “System” outperformed “Buy/Hold” 61% of the time (looking at trailing 12 month performance) and “Buy/Hold” outperformed the “System” 39% of the time.
Summary
The results presented here – utilizing 17 non-US single country ETFs – suggest that the idea that certain days of the month are better than others for stocks is not limited to U.S. stocks.
Still, while the “system” presented herein outperformed buy-and-hold by 4.8-to-1 since 1996, it only outperforms buy-and-hold 61% of the time. And in fact, in the past 12 months the “System” has gained +8.4% versus a gain of +25.6% for the “Buy/Hold” approach. So it should be noted that in a rip-roaring bull market the “Seasonal” approach can under perform simple “Buy/Hold” by a significant amount.
Still, the long-term hypothetical results depicted here do suggest a significant long-term edge for the seasonal trading day-of-the-month approach.
Disclaimer: The data presented herein were obtained from various third-party sources. While I believe the data to be reliable, no representation is made as to, and no responsibility, warranty or liability is accepted for the accuracy or completeness of such information. The information, opinions and ideas expressed herein are for informational and educational purposes only and do not constitute and should not be construed as investment advice, an advertisement or offering of investment advisory services, or an offer to sell or a solicitation to buy any security.
