Tuesday night, just 24 minutes after midnight in the eastern time zone, the Summer Solstice occurs. This marks a change of season. Summer begins in the Northern Hemisphere and and Winter in the southern Hemisphere. It may also mark a change in character for the US Dollar Index. Although there are those that use Astronomy and Planetary motion in their technical analysis I am not going there. Just observing the chart of price action in the US Dollar Index.
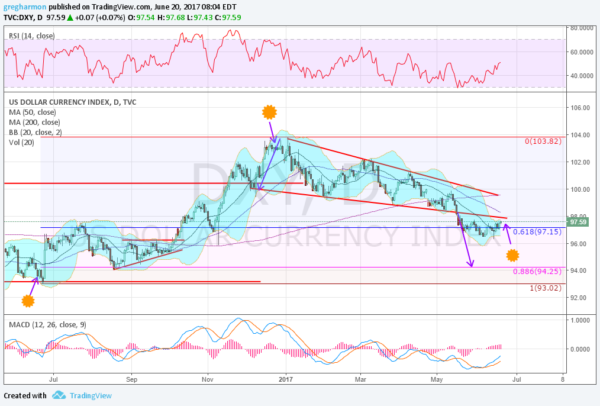
The chart below shows the price actin in the US Dollar Index over the last twelve months. It started higher in June last year, yes, right about the time of the Summer Solstice, and continued to a high plateau in mid-December. That resulted in a break out of a long consolidation channel. After 2 weeks of consolidation, that included the Winter Solstice, it started back lower.

The fall continued in a falling wedge for 5 months. In May it broke the wedge to the downside, giving a target to 94.25. That would be an 88.6% retracement of the long move higher. But the fall stopped shortly after the break down. Since the middle of May the Index has moved sideways along a 61.8% retracement of the move to the highs.
With the Summer Solstice upon us in a few hours, the price action is setting up for another move. The momentum indicators, RSI and MACD are not yet in bullish ranges, but they are showing positive divergences. And over the last few days the Bollinger Bands® have squeezed in. This is often a pre-cursor to a big move. Will this Solstice be another turning point in the US Dollar Index?
DISCLAIMER: The information in this blog post represents my own opinions and does not contain a recommendation for any particular security or investment. I or my affiliates may hold positions or other interests in securities mentioned in the Blog, please see my Disclaimer page for my full disclaimer.
