
Sealed Air Corporation (NYSE:SEE) delivered fourth-quarter 2018 adjusted earnings per share of 75 cents surpassing the Zacks Consensus Estimate of 67 cents and also surging 29% year over year.
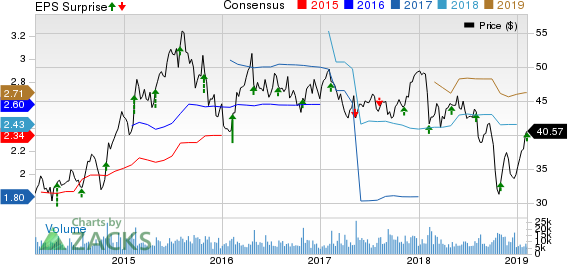
Sealed Air Corporation Price, Consensus and EPS Surprise
Sealed Air Corporation (SEE): Free Stock Analysis Report
Alarm.com Holdings, Inc. (ALRM): Free Stock Analysis Report
Enersys (ENS): Get Free Report
Axon Enterprise, Inc (AAXN): Get Free Report
Original post
Zacks Investment Research
Including special items, the company reported net earnings per share of $1.28, up from 14 cents in the year-ago quarter.
Total revenues increased 2.6% year over year on a reported basis to 1,260 million in the reported quarter. The figure outpaced the Zacks Consensus Estimate of $1,114 million. Unfavorable currency impact lowered total net sales by $48 million or 4%.
Sealed Air Corporation Price, Consensus and EPS Surprise
Cost of sales edged up 0.7% year over year to $861 million. Gross profit improved 7% to $399 million. Gross margin expanded 140 basis points (bps) to 31.7% in the fourth quarter.
SG&A expenses fell roughly 2% to $203 million from the prior-year quarter’s figure. Adjusted earnings before interest, taxes, depreciation and amortization (EBITDA) were $248 million in the quarter compared with $238 million in the prior-year quarter. Adjusted EBITDA margin was 19.7% compared with 19.4% in the prior-year quarter.
Segment Performance
Food Care: Net sales rose 1% year over year to $772 million. Adjusted EBITDA increased 12% year over year to $162 million.
Product Care: The segment reported net sales of $489 million, up 5% year over year. Adjusted EBITDA increased 5% to $85 million.
Financial Updates
Cash and cash equivalents were $272 million as of Dec 31, 2018, down from $594 million as of Dec 31, 2017. Cash flow from operating activities was around $428 million in 2018 compared with $424 million in 2017.
As of Dec 31, 2018, Sealed Air’s net debt came in at $3.2 billion, up from $2.7 billion as of Dec 31, 2017.
In, 2018, the company repurchased around 14.9 million shares for $583 million. Sealed Air has $775 million remaining under its current authorized share repurchase program. During the year, the company paid dividends worth $104 million.
2018 Results
Sealed Air reported adjusted earnings per share of $2.50 in 2018, up 38% from $1.81 in the prior year. Earnings surpassed the Zacks Consensus Estimate of $2.43. Sales increased 6% year over year to $4.73 billion, coming ahead of the Zacks Consensus Estimate of $4.72 billion.
Guidance
Sealed Air projects adjusted earnings per at $2.65-$2.75 in fiscal 2019. Net sales growth is projected to be approximately 2% on reported basis and 5% in constant dollars. Adjusted EBITDA from continuing operations is expected to be $925-$945 million. Currency is expected to have an unfavorable impact of approximately $130 million on net sales and $25 million on adjusted EBITDA.
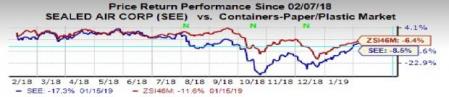
Price Performance
Shares of Sealed Air have slumped 8.5% in the past year compared with the industry’s decline of 6.4%.
Zacks Rank & Other Stocks to Consider
Sealed Air currently carries a Zacks Rank #2 (Buy). You can see the complete list of today’s Zacks #1 Rank (Strong Buy) stocks here.
Other top-ranked stocks in the Industrial Products sector are Axon Enterprise, Inc (NASDAQ:AAXN) , Alarm.com Holdings, Inc. (NASDAQ:ALRM) and EnerSys (NYSE:ENS) . While Axon and Alarm.com currently flaunt a Zacks Rank #1, EnerSys carries a Zacks Rank #2.
Axon has expected earnings growth rate of 14.5% for 2019. The company’s shares have soared 101.6% in the past year.
Alarm.com has expected earnings growth rate of 7.8% for 2019. The stock has surged 72% in a year’s time.
EnerSys has expected earnings growth rate of 9.5% for 2019. Its shares have gained 33% in the past year.
Zacks' Top 10 Stocks for 2019
In addition to the stocks discussed above, wouldn't you like to know about our 10 finest buy-and-holds for the year?
From more than 4,000 companies covered by the Zacks Rank, these 10 were picked by a process that consistently beats the market. Even during 2018 while the market dropped -5.2%, our Top 10s were up well into double-digits. And during bullish 2012 – 2017, they soared far above the market's +126.3%, reaching +181.9%.
This year, the portfolio features a player that thrives on volatility, an AI comer, and a dynamic tech company that helps doctors deliver better patient outcomes at lower costs.
Sealed Air Corporation (SEE): Free Stock Analysis Report
Alarm.com Holdings, Inc. (ALRM): Free Stock Analysis Report
Enersys (ENS): Get Free Report
Axon Enterprise, Inc (AAXN): Get Free Report
Original post
Zacks Investment Research