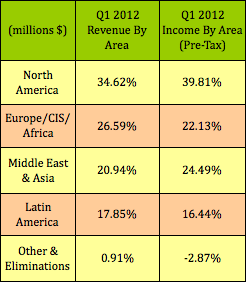
Schlumberger, (SLB), is the world’s largest oilfield services provider, whose $83 billion market cap dwarfs those of its competitors, such as Halliburton (HAL) and Baker Hughes (BHI). Like most Basic Materials/Energy-related stocks, SLB has been getting hammered this year, due to a number of factors – slowing Chinese and US growth, Eurozone problems, and declining oil prices. However, the oil price decline is a 2-edged sword, because some of that decline is due to the new shale oil discoveries that are being exploited via fracking in the US, which is Schlumberger’s biggest and most lucrative market:
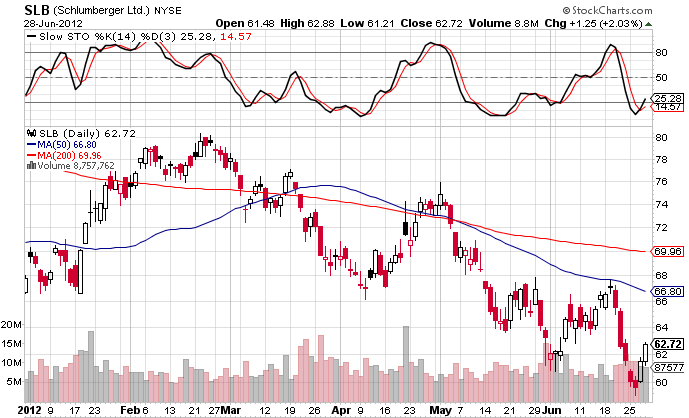
Buy Signal- Schlumberger dipped below the oversold 20 line on its Stochastic chart, but just crossed back above the line this week, which is seen by chartists as a buy signal:
Due to its low 1.79% dividend, we don’t list SLB in our High Dividend Stocks By Sector Tables.
But we do list an actionable Covered Call trade for SLB in our Covered Calls Table. Selling covered call options allows you to greatly improve upon the income you receive from dividend stocks, on a short term basis, allowing you to double your dividend with a second income stream.
In fact, in this SLB trade, the call option premiums are over 10 times the amount of the two dividends over the 7-month term:
Professional traders often will sell Cash Secured Put Options on a stock, instead of buying it outright, as a way of generating high yield cash flow, and achieving a lower entry point. Similar to the covered call trade above, this trade’s put options premiums are nearly 10 times the amount of the dividends between now and January expiration:
Undervalued Growth: SLB looks undervalued on a Price/Earnings Growth basis for 2012 and 2013. SLB’s current P/E of 16.55 is just above its 5-year median P/E of 15.41:
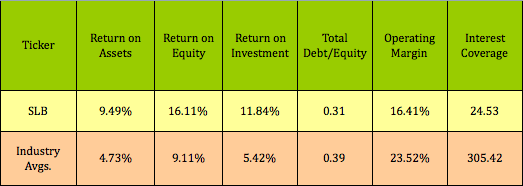
Financials: SLB’s Mgt. Efficiency ratios and Debt/Equity load are better than its peers. However, its Operating Margin, which is normally over 20%, slipped to 16.41%, due to activity disruptions from the geopolitical unrest in North Africa and in the Middle East during the first quarter of 2011.
Technical Data: SLB is in the red for the year, and way off of its 52-week high, which may have helped spur more insider buying. Basic Materials stocks are also coming back into favor, as this sector was the 4th biggest gainer over the past month, up over 4%:
Disclosure: Author has no current positions in SLB,
Disclaimer: This article is written for informational purposes only and isn’t intended as investment advice.
- English (UK)
- English (India)
- English (Canada)
- English (Australia)
- English (South Africa)
- English (Philippines)
- English (Nigeria)
- Deutsch
- Español (España)
- Español (México)
- Français
- Italiano
- Nederlands
- Português (Portugal)
- Polski
- Português (Brasil)
- Русский
- Türkçe
- العربية
- Ελληνικά
- Svenska
- Suomi
- עברית
- 日本語
- 한국어
- 简体中文
- 繁體中文
- Bahasa Indonesia
- Bahasa Melayu
- ไทย
- Tiếng Việt
- हिंदी
Schlumberger Just Sent A Buy Signal
Published 07/01/2012, 02:10 AM
Updated 07/09/2023, 06:31 AM
Schlumberger Just Sent A Buy Signal
Latest comments
Loading next article…
Install Our App
Risk Disclosure: Trading in financial instruments and/or cryptocurrencies involves high risks including the risk of losing some, or all, of your investment amount, and may not be suitable for all investors. Prices of cryptocurrencies are extremely volatile and may be affected by external factors such as financial, regulatory or political events. Trading on margin increases the financial risks.
Before deciding to trade in financial instrument or cryptocurrencies you should be fully informed of the risks and costs associated with trading the financial markets, carefully consider your investment objectives, level of experience, and risk appetite, and seek professional advice where needed.
Fusion Media would like to remind you that the data contained in this website is not necessarily real-time nor accurate. The data and prices on the website are not necessarily provided by any market or exchange, but may be provided by market makers, and so prices may not be accurate and may differ from the actual price at any given market, meaning prices are indicative and not appropriate for trading purposes. Fusion Media and any provider of the data contained in this website will not accept liability for any loss or damage as a result of your trading, or your reliance on the information contained within this website.
It is prohibited to use, store, reproduce, display, modify, transmit or distribute the data contained in this website without the explicit prior written permission of Fusion Media and/or the data provider. All intellectual property rights are reserved by the providers and/or the exchange providing the data contained in this website.
Fusion Media may be compensated by the advertisers that appear on the website, based on your interaction with the advertisements or advertisers.
© 2007-2025 - Fusion Media Limited. All Rights Reserved.
