SBA Communications (NASDAQ:SBAC) is a real estate investment trust, providing wireless communications infrastructure to companies like Verizon and AT&T. SBAC went public in mid-1999, only to participate in the final months of the dot-com bubble before it all came crashing down.
The stock exceeded $57 a share in the summer of 2000. By late-2002, it could be bought for less than a dollar. Fortunately, the company survived. What followed was one of the best growth stories investors could possibly imagine. Nearly two decades later now, SBAC is hovering around $274 after reaching $328 in September, 2020.
Is this 16% pullback a buying opportunity and what is left of SBA’s uptrend? Let’s see if applying the Elliott Wave principle to the chart below can help us answer these questions.

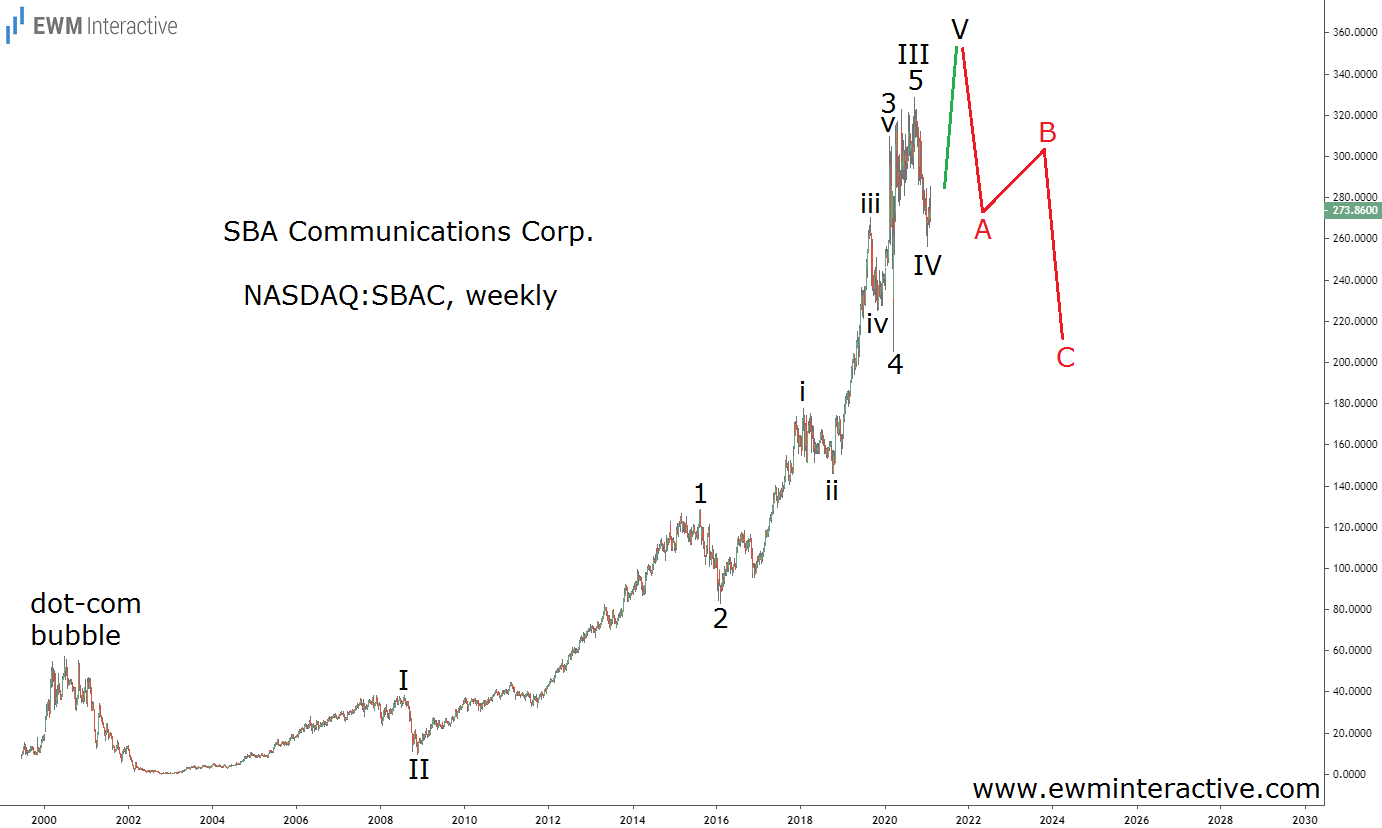
The wave count starts from the dot-com bust lows in 2002. The surge investors have been enjoying over the past 19 years can be seen as a five-wave impulse with a missing fifth wave. The pattern is labeled I-II-III-IV-V, where wave III, as it usually happens, is much longer than wave I.
Approaching $400, SBAC Stock Bulls Face Major Elliott Wave Resistance
The five sub-waves of waves III and 3 of III are also visible and marked 1-2-3-4-5 and i-ii-iii-iv-v, respectively. According to this count, last year’s coronavirus selloff fits into the position of wave 4 of III. The following all-time high marks the end of wave 5 of III, which means the current dip must be wave IV.
If the analysis so far is correct, the bulls are about to make one last push to a new record in wave V. Unfortunately for them, the theory states that a three-wave correction follows every impulse. A bearish reversal between $350 and $400 followed by a decline to the 2020 lows near $200 would make sense.
From a purely valuation standpoint, SBAC’s 2021 P/FFO of 30 makes both $400 and $200 plausible targets. Investors should simply not get too carried away when the first one is reached. The drop to the second one would be unnecessarily painful.
