Investing.com’s stocks of the week
Saudi Stock Exchange: getting closer to resistance zone that could lead to a pullback
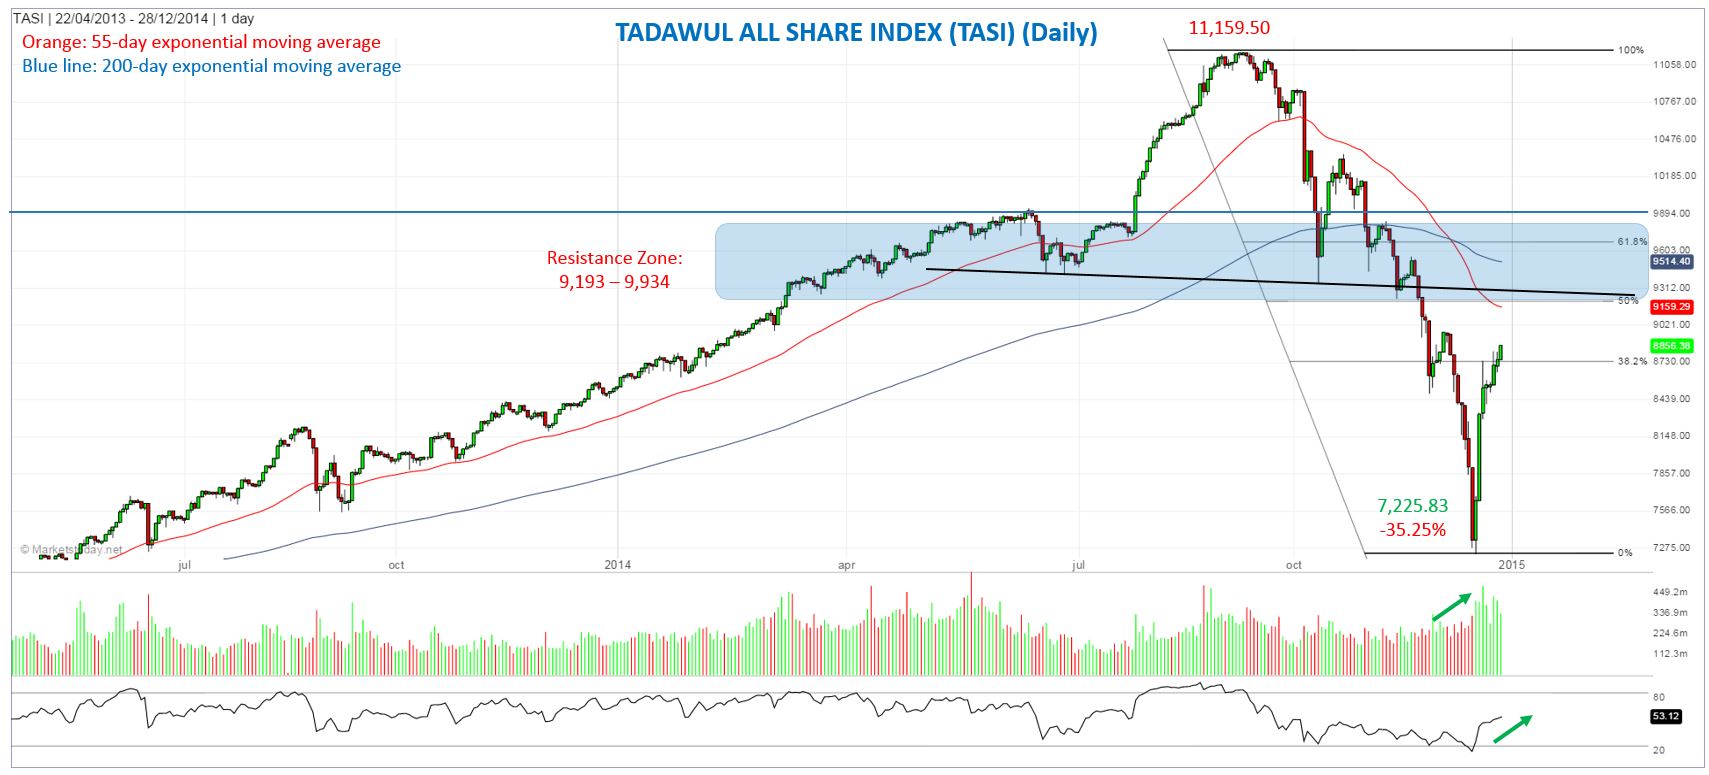
For the past seven days the TASI has rebounded 22.70% from its corrective low of 7,225.83 hit on December 17, with the rally accompanied by increasing volume. That low completed a 35.25% correction off the 11,159.50 peak reached in September (13-week decline). The 38.2% Fibonacci retracement has now been exceeded and the TASI is heading up into a large potential resistance zone, which is likely to turn the Saudi market back down for a re-test of support towards the recent lows.

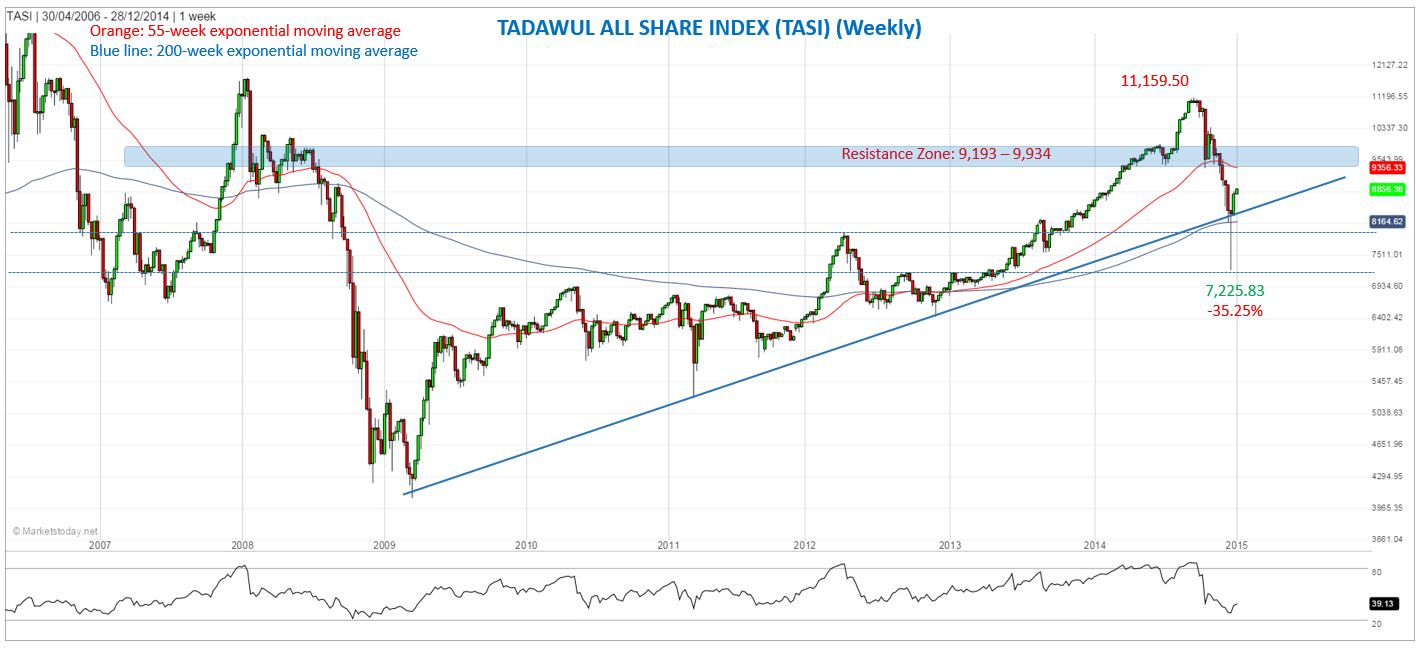
During the recent decline the TASI fell well below its 200-week exponential moving average (ema) and its long-term uptrend line, but it managed to finish the week above each, supporting the idea that a bottom has likely been put in. At the same time the 55-day ema has crossed down through the 200-day ema, a sign that the intermediate trend is changing and therefore volatility might remain high for a while longer.

The potential resistance zone is identified from approximately 9,193 to 9,934, consisting of a combination of previous price action, Fibonacci retracement levels and moving averages. Fibonacci levels are at 9,193 (50% retracement) and 9,656.84 (61.8% retracement), while the 200-day ema is at 9,514.40, and the 55-week ema is at 9,356.33. (www.marketstoday.net)
