Saudi Stock Exchange finds short-term support
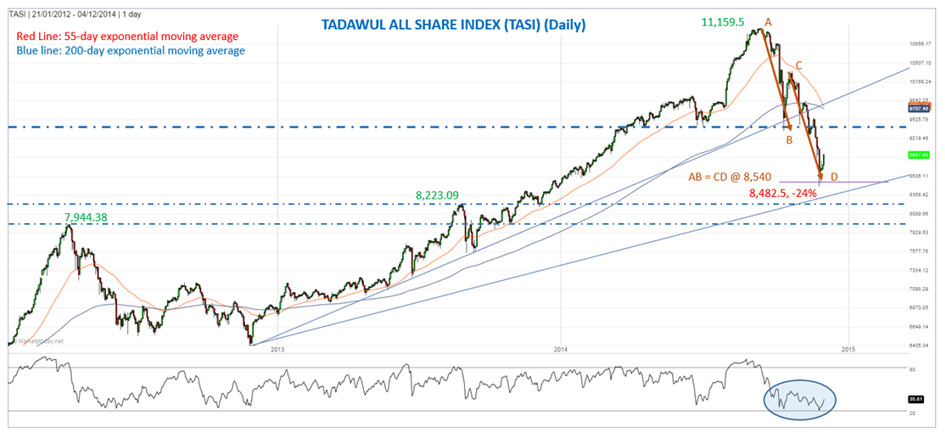
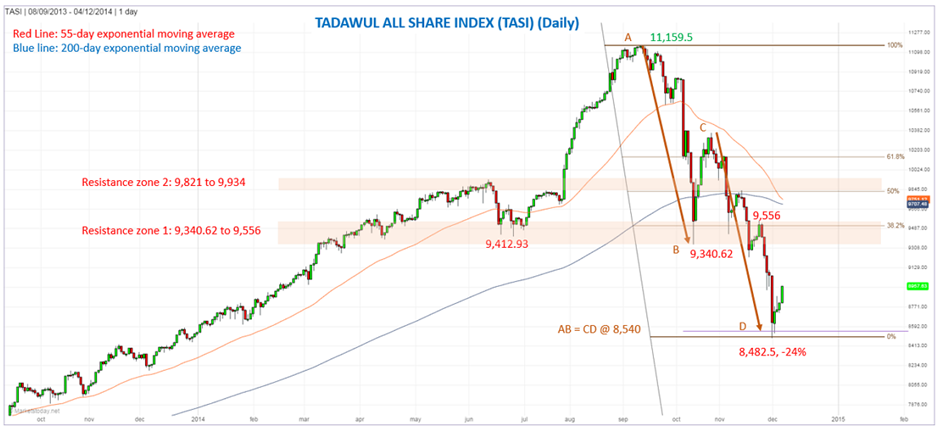
Last week the Tadawul All Share (TASI) completed a bearish AB=CD pattern (discussed previously hereand here) at 8,540. The low for the week, and now support, was at 8,482.50. That’s 24% below the September 9th peak of 11,159.5, with the decline taking eleven weeks.
A potential double bottom reversal may now be forming in the RSI indicator in oversold territory. Oversold levels are at 20 rather than below 20 given the aggressive uptrend that has occurred since the 2009 bottom. This would indicate a higher bounce is likely.

So far the index has advanced 5.6% from last week’s low to the weekly close of 8,957.63. The first resistance zone starts at around 9,340.62 and goes up to approximately 9,556, as can be seen on the accompanying chart. That price zone is derived from previous support and resistance levels, and includes the 38.2% Fibonacci retracement (minimum anticipated retracement based on Fibonacci analysis) at 9,505.11.
The second potential resistance zone is from approximately 9,821 to 9,934, also derived from prior resistance levels. This zone begins at the 50% retracement of 9,821.
A daily close below last week’s low of 8,482.50 negates the above short-term bullish scenario.

