SandRidge Energy, Inc. (SandRidge) is an independent oil and natural gas company. It is engaged in development and production activities related to the exploitation of its holdings in West Texas and the Mid-Continent area of Oklahoma and Kansas.
Earlier I wrote on SPRD and the exploding vol with accompanying growing short interest. For the second note today let's go the other direction -- depressed vol.
I found SD stock using a real-time custom scan. This one hunts for low vols.
Custom Scan Details
Stock Price GTE $7
IV30™ - HV20™ LTE -8 GTE -40
HV180™ - IV30™ GTE 7
Average Option Volume GTE 1,200
Industry != Bio-tech
Days After Earnings GTE 32
The goal with this scan is to identify short-term implied vol (IV30™) that is depressed both to the recent stock movement (HV20) and the long term trend in stock movement (HV180). I'm also looking for a reasonable amount of liquidity in the options (thus the minimum average option volume), want to avoid bio-techs (and their crazy vol) and make sure I'm not purchasing depressed IV30™ relative to HV20 simply because of a large earnings move.
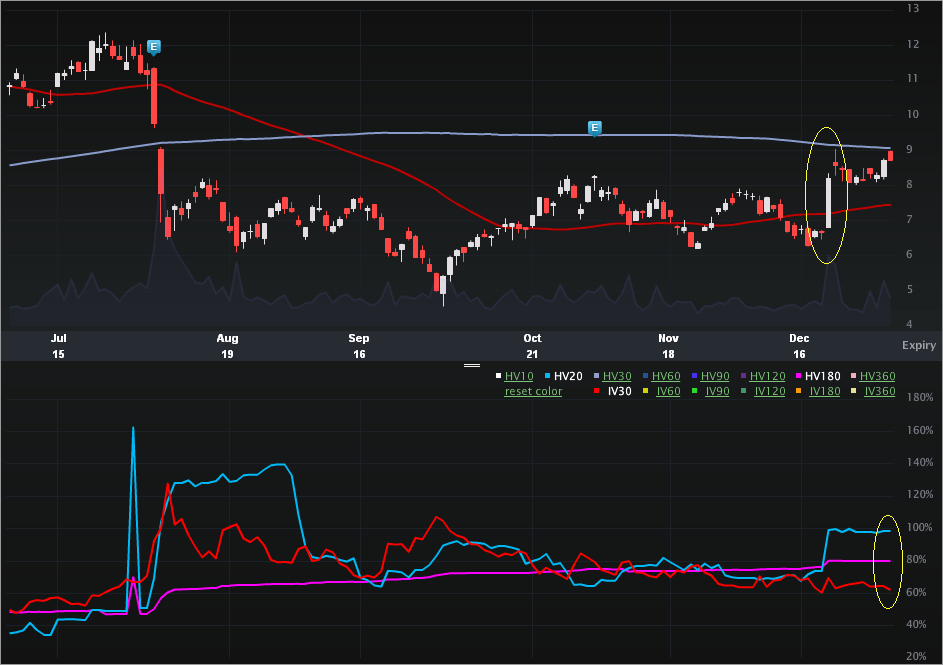
The SD Charts Tab is included (below). The top portion is the stock price, the bottom is the vol (IV30™ - red vs HV20 - blue vs HV180 - pink).

The stock portion is pretty wild. Two earnings cycles ago, the stock collapsed from $11.17 down to $6.55 two days after the report. On 12-22-2011, the stock popped from $6.67 to $8.21 on news of a PP&E sale. Here's that news snippet from The Motely Fool:
The company sold 363,636 net acres in the Mississippian basin to a joint venture funded by Repsol for $250 million and an additional $750 million drilling carry obligation. The venture is buying a 25% non-operated working interest in the Extension Mississippian play and a 16% non-operated working interest in the Original Mississippian play.
Sandridge Energy Shares Popped: What You Need to Know, written by Travis Hoium
Well, there you go. The article goes on to offer the possibility that this cash infusion could be a catalyst for future growth (and solvency).
Looking to the vol portion, we can see the stock pop pushed the historical realized vol up, but the implied has sort of, sat there. While the HV20 is "artificially" elevated because of the recent move, it is interesting to note that the implied is depressed relative to the long-term historical realized measure as well. The vol comps are:
IV30™: 62.09%
HV20: 98.67%
HV180: 80.06%
The 52 wk range in IV30™ for SD is [42.43%, 127.84%]. This puts the current implied at the 23rd percentile. In English, the implied is depressed to its own history (annual) and to the short-term and long-term realized historical vols.
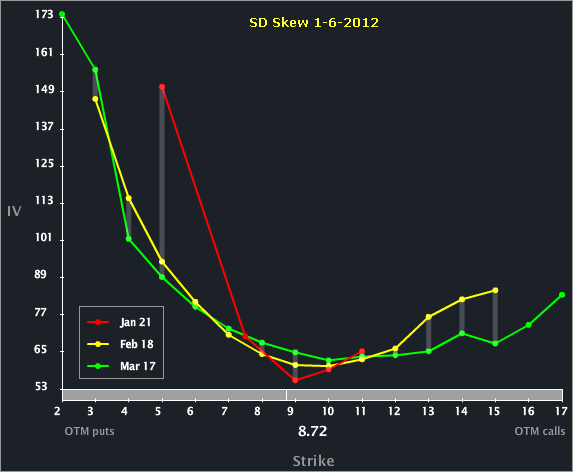
Let's turn to the Skew Tab.

We can see that the Jan ATM vol is in fact the lowest vol of all strikes across all three front expiries. All three expiries demonstrate an upside skew to the OTM calls as well. The option market reflects two-sided tail risk.
The next earnings cycle for SD is likely going to be in late Feb (after Feb expo). That can explain why the Mar ATM vol is the highest of the three front months.
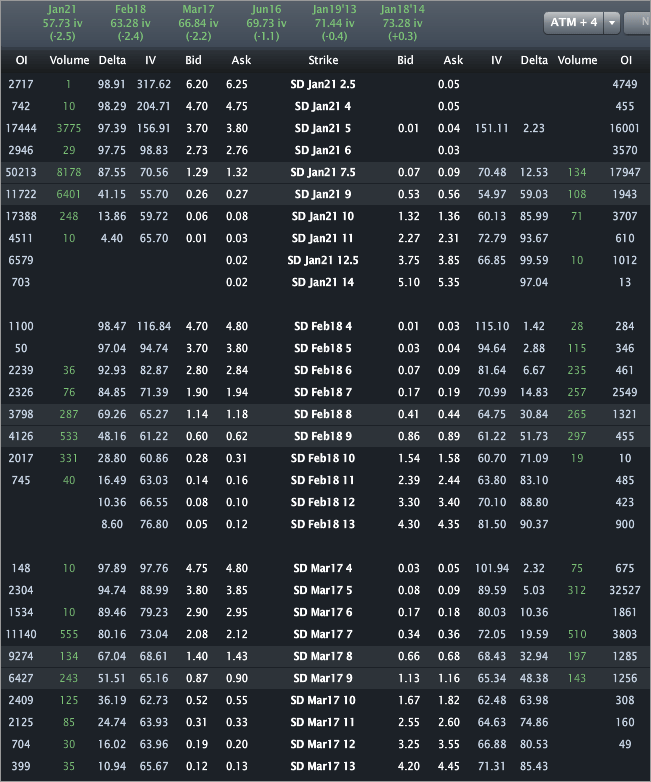
Finally, let's look to the Options Tab (below).

What is interesting is not just that the front three months show monotonic vol increases (earnings explains that), but that the Jun, Jan'13 an Jan'14 leaps also continue that trend. The Jan, Feb, Mar, Jun, Jan'13, Jan'14 vols are priced to 57.73%, 63.28%, 66.84%, 69.73%, 71.44% and 73.28%, respectively. Given the recent move in the stock on what was apparently a "surprise" announcement, that's... weird...
This is trade analysis, not a recommendation.
Earlier I wrote on SPRD and the exploding vol with accompanying growing short interest. For the second note today let's go the other direction -- depressed vol.
I found SD stock using a real-time custom scan. This one hunts for low vols.
Custom Scan Details
Stock Price GTE $7
IV30™ - HV20™ LTE -8 GTE -40
HV180™ - IV30™ GTE 7
Average Option Volume GTE 1,200
Industry != Bio-tech
Days After Earnings GTE 32
The goal with this scan is to identify short-term implied vol (IV30™) that is depressed both to the recent stock movement (HV20) and the long term trend in stock movement (HV180). I'm also looking for a reasonable amount of liquidity in the options (thus the minimum average option volume), want to avoid bio-techs (and their crazy vol) and make sure I'm not purchasing depressed IV30™ relative to HV20 simply because of a large earnings move.
The SD Charts Tab is included (below). The top portion is the stock price, the bottom is the vol (IV30™ - red vs HV20 - blue vs HV180 - pink).

The stock portion is pretty wild. Two earnings cycles ago, the stock collapsed from $11.17 down to $6.55 two days after the report. On 12-22-2011, the stock popped from $6.67 to $8.21 on news of a PP&E sale. Here's that news snippet from The Motely Fool:
The company sold 363,636 net acres in the Mississippian basin to a joint venture funded by Repsol for $250 million and an additional $750 million drilling carry obligation. The venture is buying a 25% non-operated working interest in the Extension Mississippian play and a 16% non-operated working interest in the Original Mississippian play.
Sandridge Energy Shares Popped: What You Need to Know, written by Travis Hoium
Well, there you go. The article goes on to offer the possibility that this cash infusion could be a catalyst for future growth (and solvency).
Looking to the vol portion, we can see the stock pop pushed the historical realized vol up, but the implied has sort of, sat there. While the HV20 is "artificially" elevated because of the recent move, it is interesting to note that the implied is depressed relative to the long-term historical realized measure as well. The vol comps are:
IV30™: 62.09%
HV20: 98.67%
HV180: 80.06%
The 52 wk range in IV30™ for SD is [42.43%, 127.84%]. This puts the current implied at the 23rd percentile. In English, the implied is depressed to its own history (annual) and to the short-term and long-term realized historical vols.
Let's turn to the Skew Tab.

We can see that the Jan ATM vol is in fact the lowest vol of all strikes across all three front expiries. All three expiries demonstrate an upside skew to the OTM calls as well. The option market reflects two-sided tail risk.
The next earnings cycle for SD is likely going to be in late Feb (after Feb expo). That can explain why the Mar ATM vol is the highest of the three front months.
Finally, let's look to the Options Tab (below).

What is interesting is not just that the front three months show monotonic vol increases (earnings explains that), but that the Jun, Jan'13 an Jan'14 leaps also continue that trend. The Jan, Feb, Mar, Jun, Jan'13, Jan'14 vols are priced to 57.73%, 63.28%, 66.84%, 69.73%, 71.44% and 73.28%, respectively. Given the recent move in the stock on what was apparently a "surprise" announcement, that's... weird...
This is trade analysis, not a recommendation.
