Salesforce Bulls To Head For The Exits Soon

Published 02/02/2020, 05:58 AM
Updated 07/09/2023, 06:31 AM
SSFO34
-

Salesforce com (SA:SSFO34) stock fell to $2.25 in August 2004. What followed is nothing short of spectacular. Shares closed at $182.31 on Friday, up 8000% or 34% compounded annually. In other words, CRM multiplied investors’ money by 81 in less than 16 years.

However, even traditional valuation measures indicate the stock is getting ahead of itself. No trend lasts forever and we believe Salesforce is not immune to gravity, either. The chart below puts its phenomenal uptrend into Elliott Wave perspective.
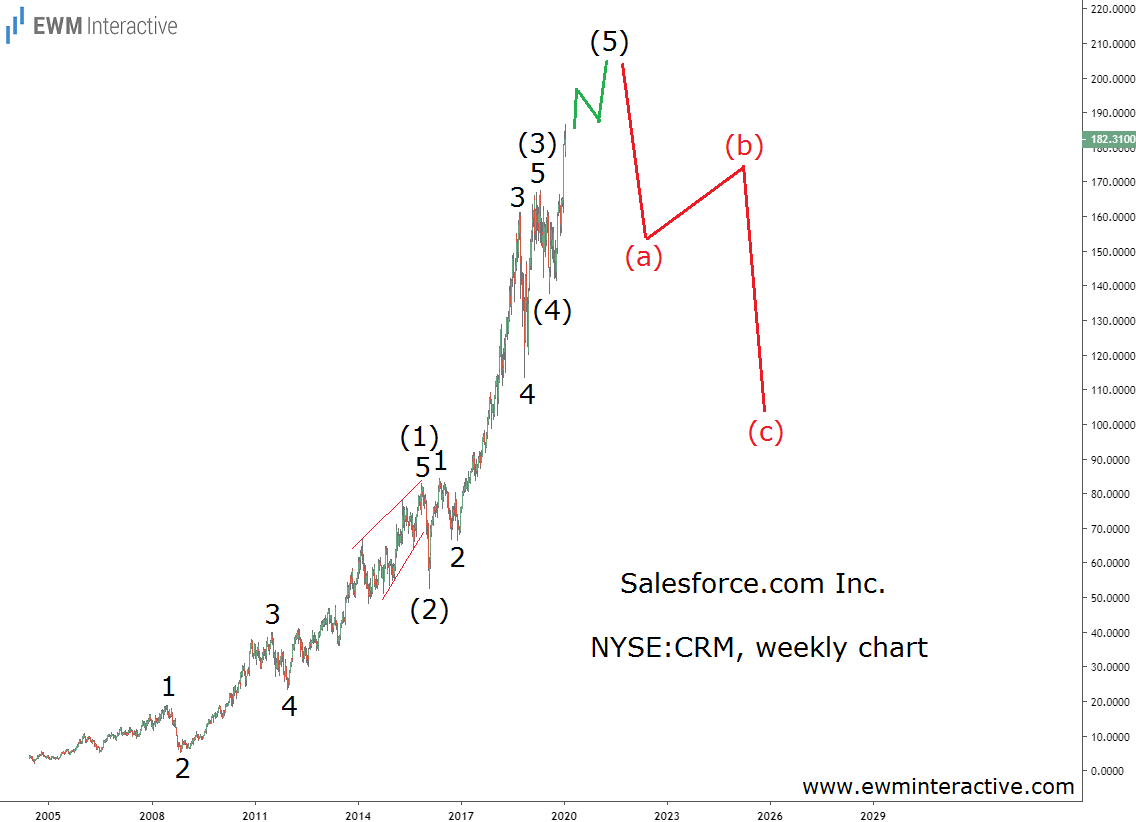
Salesforce Inc Weekly Chart

The rally to $186.44 so far looks like an almost complete five-wave impulse. The pattern is labeled (1)-(2)-(3)-(4)-(5), where the sub-waves of (1) and (3) are also visible. It looks like the latest all-time high is part of the fifth and final wave.

According to the theory, a three-wave correction in the other direction follows every impulse. The $200 a share mark seems to be within the bulls reach. On the other hand, once wave (5) ends, a notable retracement should be expected. Given Salesforce .com’s stretched valuation, a 40% to 50% decline does make sense. In our opinion, CRM carries more risk than reward at current price levels.

Original Post

Latest comments

Loading next article…
Risk Disclosure: Trading in financial instruments and/or cryptocurrencies involves high risks including the risk of losing some, or all, of your investment amount, and may not be suitable for all investors. Prices of cryptocurrencies are extremely volatile and may be affected by external factors such as financial, regulatory or political events. Trading on margin increases the financial risks.
Before deciding to trade in financial instrument or cryptocurrencies you should be fully informed of the risks and costs associated with trading the financial markets, carefully consider your investment objectives, level of experience, and risk appetite, and seek professional advice where needed.
Fusion Media would like to remind you that the data contained in this website is not necessarily real-time nor accurate. The data and prices on the website are not necessarily provided by any market or exchange, but may be provided by market makers, and so prices may not be accurate and may differ from the actual price at any given market, meaning prices are indicative and not appropriate for trading purposes. Fusion Media and any provider of the data contained in this website will not accept liability for any loss or damage as a result of your trading, or your reliance on the information contained within this website.
It is prohibited to use, store, reproduce, display, modify, transmit or distribute the data contained in this website without the explicit prior written permission of Fusion Media and/or the data provider. All intellectual property rights are reserved by the providers and/or the exchange providing the data contained in this website.
Fusion Media may be compensated by the advertisers that appear on the website, based on your interaction with the advertisements or advertisers.
© 2007-2025 - Fusion Media Limited. All Rights Reserved.