Safeway Inc. (Safeway) is a food and drug retailer in North America. As of December 3 1, 2011, the Company had 1,678 stores.
I found this stock using a custom scan searching for names where IV30™ is up at least 10% on the day. This is a takeover rumor name with earnings likely in the second month, making for an interesting vol set-up. The implied in this name has been up nearly 75% over the last four weeks and today's news adds to that trend pushing IV30™ to nearly a double since 3-19-2012.
The scan details are below with a snapshot if you want to build it yourself in Livevol® Pro.
Custom Scan Details
Stock Price GTE 10
Average Option Volume GTE 1,200
Days After Earnings GTE 5 and LTE 60
IV30™ Percent Change GTE 10%
IV30™ GTE 10
Let's start with the news today that's pushing vol today:
Rumor Round Up
* Safeway (SWY) spiked higher following takeover rumors.
While many rumors circulate during the day, and the validity of the source of these rumors can be questionable, the speculation may increase volatility in the near term.
Source: Provided by Briefing.com (www.briefing.com)
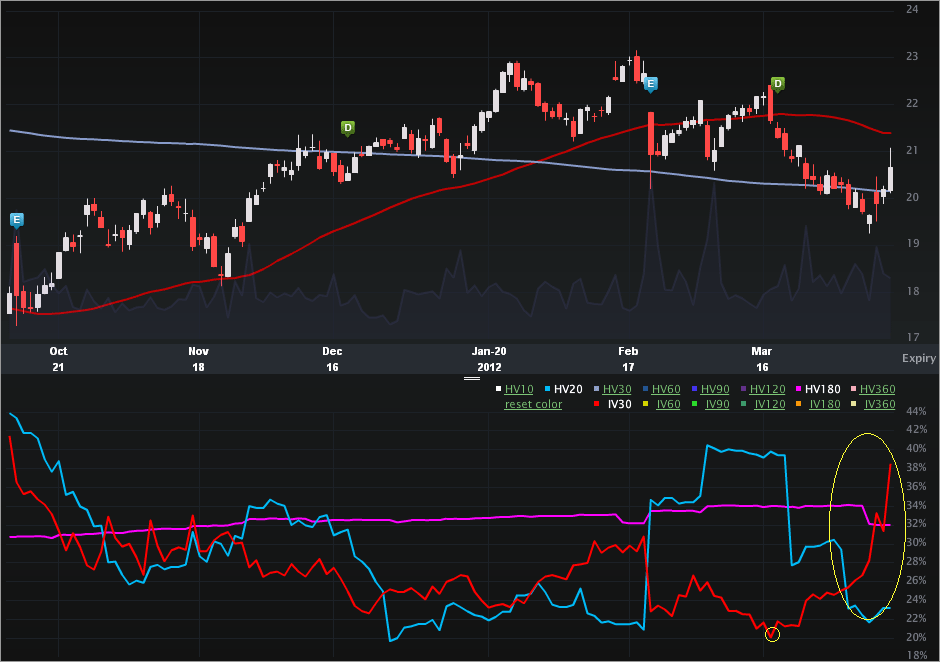
The SWY Charts Tab is included below and helps illustrate the awesome vol climb of late. The top portion is the stock price, the bottom is the vol (IV30™ - red vs HV20™ - blue vs HV180™ - pink).

Starting with the stock price portion, we can see how the underlying has climbed from the mid $17 level, to now over $20.50. But, it's the vol portion that is so interesting. I've highlighted the recent run up, but if you look to mid Mar, we can see how the implied actually hit its annual low on 3-19-2012. From that point, the vol has gone straight up and is now in the 72nd percentile (annual). The 52 wk range in IV30™ is [20.08%, 45.39%].
The implied is now well above both of the historical measures. The vol comps are:
IV30™: 38.51%
HV20™: 23.23%
HV180™: 31.98%
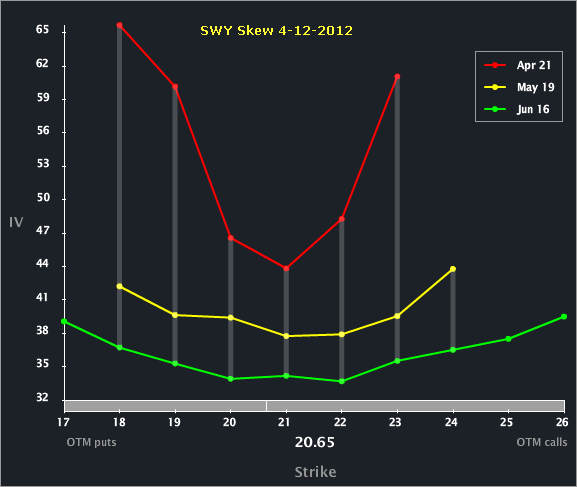
The Skew Tab (below) illustrates the vols by strike by month and uncovers another interesting phenomenon.

Check out how elevated Apr vol is to the back months, and in specific, to May. The last two earnings releases for SWY in calendar Q2 were 4-29-2010 and 4-28-2011. It's a reasonable bet that the next earnings release for SWY will be in the May expiry and outside Apr. That means that the depressed vol in May (relative to Apr) has an embedded vol event.
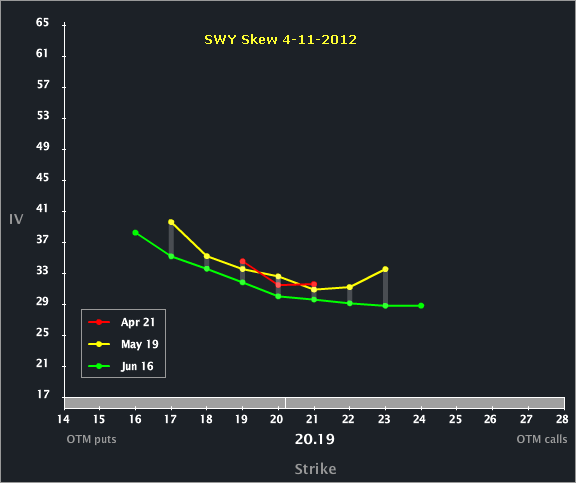
I was wondering how much the rumor today moved the skew, specifically wrt the Apr to May comp. I've included the Skew Tab snap from yesterday, below.

We can plainly see how the front month was in fact depressed slightly to May as of yesterday's close, and how much the rumor has changed that term structure relationship. Come on, Livevol® Pro is pretty awesome, no?...
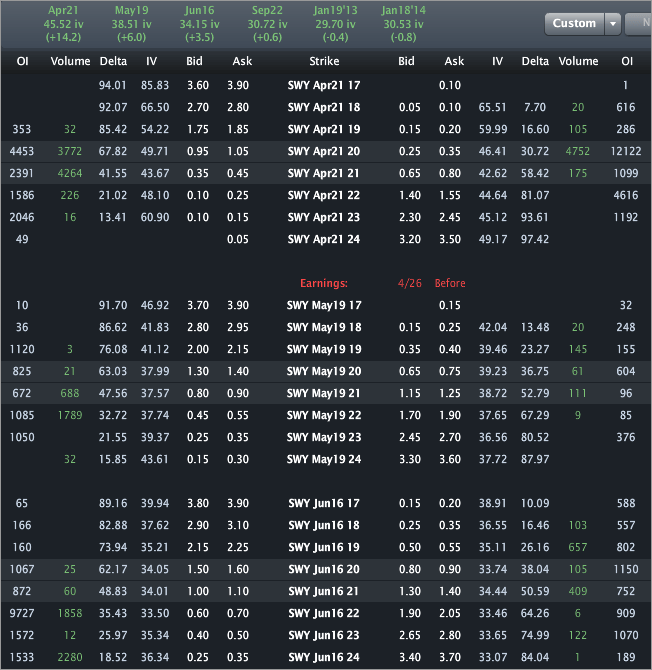
Finally, let's turn to the Options Tab, for completeness.

Putting numbers to the images, Apr vol is priced to 45.52% (that's above the annual high in IV30™) while May is priced to 38.51%.
This is trade analysis, not a recommendation.
I found this stock using a custom scan searching for names where IV30™ is up at least 10% on the day. This is a takeover rumor name with earnings likely in the second month, making for an interesting vol set-up. The implied in this name has been up nearly 75% over the last four weeks and today's news adds to that trend pushing IV30™ to nearly a double since 3-19-2012.
The scan details are below with a snapshot if you want to build it yourself in Livevol® Pro.
Custom Scan Details
Stock Price GTE 10
Average Option Volume GTE 1,200
Days After Earnings GTE 5 and LTE 60
IV30™ Percent Change GTE 10%
IV30™ GTE 10
Let's start with the news today that's pushing vol today:
Rumor Round Up
* Safeway (SWY) spiked higher following takeover rumors.
While many rumors circulate during the day, and the validity of the source of these rumors can be questionable, the speculation may increase volatility in the near term.
Source: Provided by Briefing.com (www.briefing.com)
The SWY Charts Tab is included below and helps illustrate the awesome vol climb of late. The top portion is the stock price, the bottom is the vol (IV30™ - red vs HV20™ - blue vs HV180™ - pink).

Starting with the stock price portion, we can see how the underlying has climbed from the mid $17 level, to now over $20.50. But, it's the vol portion that is so interesting. I've highlighted the recent run up, but if you look to mid Mar, we can see how the implied actually hit its annual low on 3-19-2012. From that point, the vol has gone straight up and is now in the 72nd percentile (annual). The 52 wk range in IV30™ is [20.08%, 45.39%].
The implied is now well above both of the historical measures. The vol comps are:
IV30™: 38.51%
HV20™: 23.23%
HV180™: 31.98%
The Skew Tab (below) illustrates the vols by strike by month and uncovers another interesting phenomenon.

Check out how elevated Apr vol is to the back months, and in specific, to May. The last two earnings releases for SWY in calendar Q2 were 4-29-2010 and 4-28-2011. It's a reasonable bet that the next earnings release for SWY will be in the May expiry and outside Apr. That means that the depressed vol in May (relative to Apr) has an embedded vol event.
I was wondering how much the rumor today moved the skew, specifically wrt the Apr to May comp. I've included the Skew Tab snap from yesterday, below.

We can plainly see how the front month was in fact depressed slightly to May as of yesterday's close, and how much the rumor has changed that term structure relationship. Come on, Livevol® Pro is pretty awesome, no?...
Finally, let's turn to the Options Tab, for completeness.

Putting numbers to the images, Apr vol is priced to 45.52% (that's above the annual high in IV30™) while May is priced to 38.51%.
This is trade analysis, not a recommendation.
