Yesterday we noted that while there were a decent amount of three day selloffs in 2013, the four day selloff was rare indeed, so it would be interesting to see if the bulls showed up today. Indeed they did, with futures up sharply and the market never looking back after gapping up at the open. The S&P 500 gained 0.61% while tech stocks led the NASDAQ higher, to a gain of 0.96%. Keep in mind tomorrow afternoon we get the release of the Fed minutes from the meeting where they cut quantitative easing. The key economic report of the day was the trade deficit which fell to the smallest level in 4 years as energy exports have created a mini boom in the U.S.:
The Commerce Department said the current account gap, which measures the flow of goods, services and investments into and out of the country, narrowed to $94.8 billion. That was the smallest since the third quarter of 2009 and was an improvement from a revised shortfall of $96.6 billion in the second quarter.
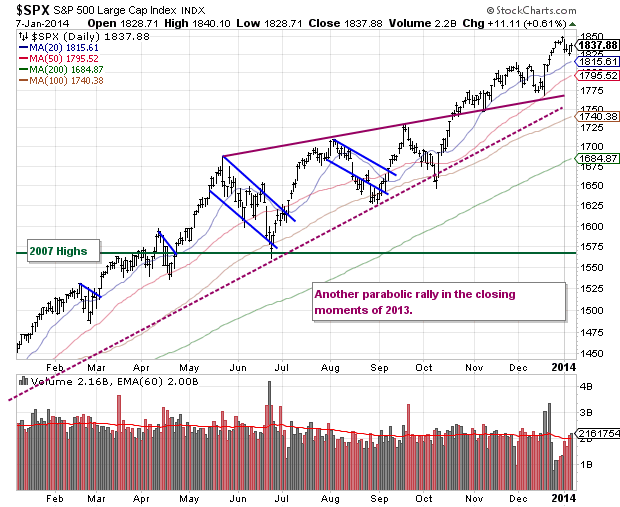
Technically there has been nothing wrong with this 3 day pullback; it was overdue with the parabolic run at the end of 2013, and breadth measures remain healthy while no major support lines have been broken. We'll look at the longer term charts today - as we have been mentioning the past few months, the NASDAQ really has been the "easy one" to follow on this time frame for obvious reasons.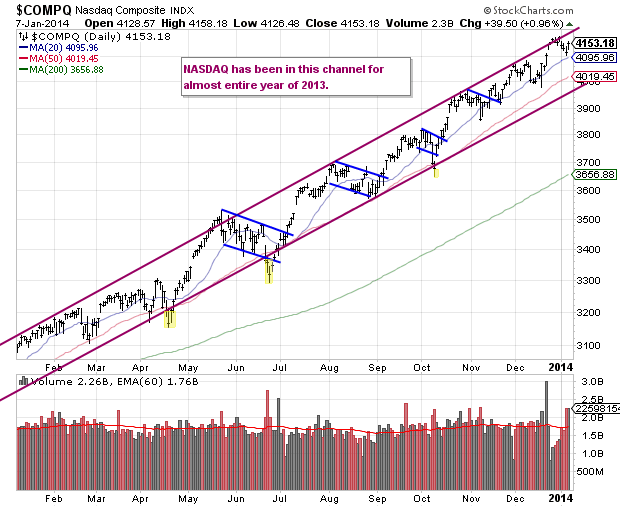
JPMorgan, which has an "overweight" rating on Google, raised its target price on the stock to $1,305 from $1,100.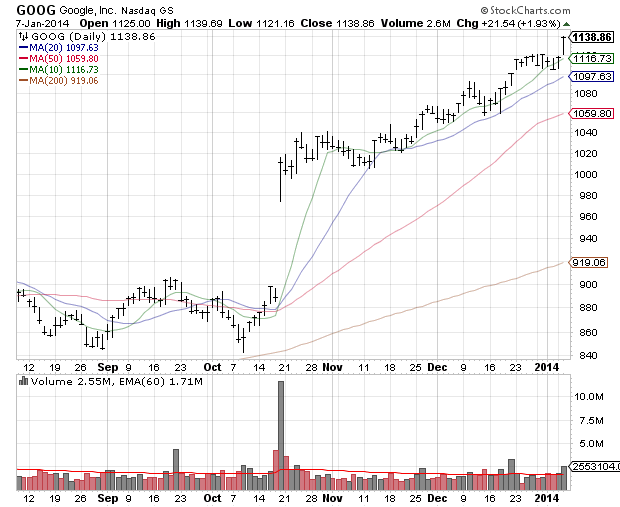
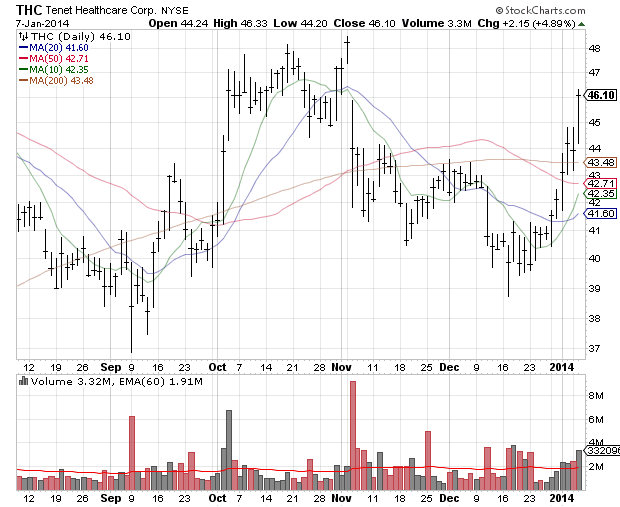
Healthcare was also in spotlight today as Deutsche Bank upgraded insurance company UnitedHealth Group (UNH) -which is a Dow component - to a "buy." Tenet Healthcare (THC) shares also surged.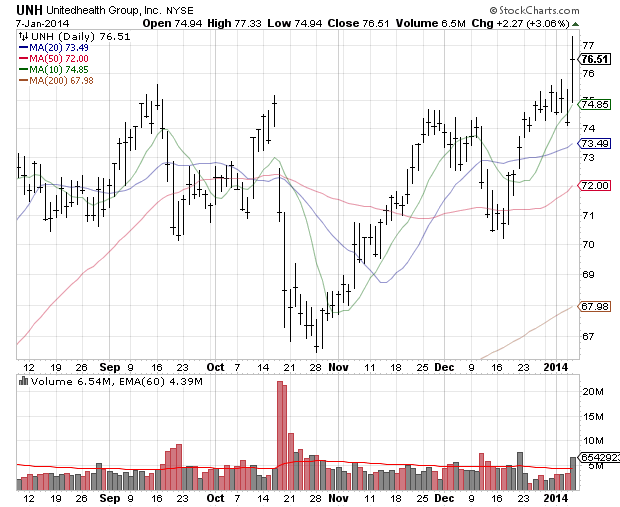
We've talked a lot about U.S. social media companies the past few years, but today we will highlight one in China: YY ...which conveniently has the same symbol as name. It is not a tiny company, as its market cap is over $3B but it highlights why you always want to be on the lookout for high volume breakouts. Note the volume in the lower pane as it broke out Jan 2... well above the average as shown by the red line. Then volume exploded even higher on the 3rd of January...and has continued to be high the past 2 sessions. Now at this point it is overbought but a good example of a high volume breakout pattern.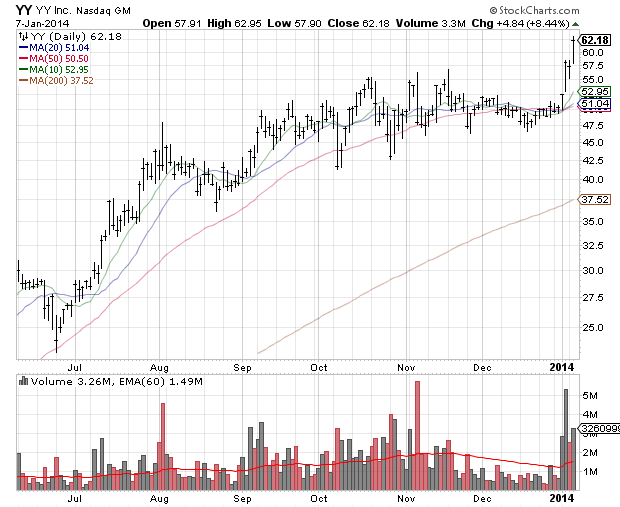
Another example are the solar companies, which have come back into favor by the momentum crowd in 2014. See Canadian Solar (CSIQ) below - all the same hallmarks as the YY chart with a massive volume spike.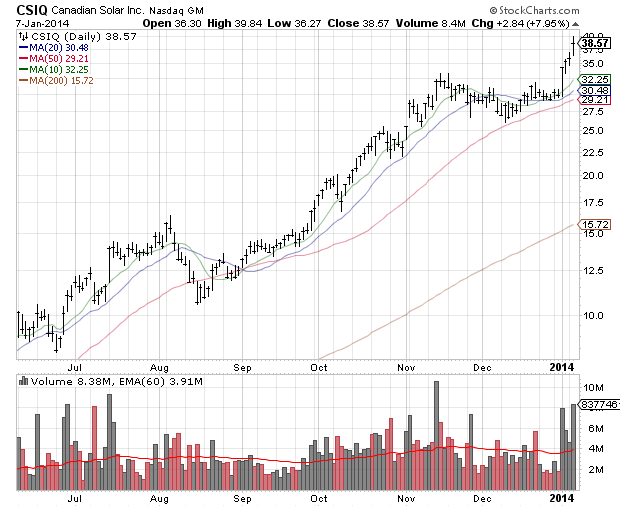
Guess which state had the most people move to it last year? Probably not one anyone would guess; hint - it is in the northwest.
Original post
- English (UK)
- English (India)
- English (Canada)
- English (Australia)
- English (South Africa)
- English (Philippines)
- English (Nigeria)
- Deutsch
- Español (España)
- Español (México)
- Français
- Italiano
- Nederlands
- Português (Portugal)
- Polski
- Português (Brasil)
- Русский
- Türkçe
- العربية
- Ελληνικά
- Svenska
- Suomi
- עברית
- 日本語
- 한국어
- 简体中文
- 繁體中文
- Bahasa Indonesia
- Bahasa Melayu
- ไทย
- Tiếng Việt
- हिंदी
S&PP 500 Gained 0.61%, While Tech Stocks Led The Nasdaq Higher
Published 01/08/2014, 12:44 AM
Updated 07/09/2023, 06:31 AM
S&PP 500 Gained 0.61%, While Tech Stocks Led The Nasdaq Higher
Latest comments
Loading next article…
Install Our App
Risk Disclosure: Trading in financial instruments and/or cryptocurrencies involves high risks including the risk of losing some, or all, of your investment amount, and may not be suitable for all investors. Prices of cryptocurrencies are extremely volatile and may be affected by external factors such as financial, regulatory or political events. Trading on margin increases the financial risks.
Before deciding to trade in financial instrument or cryptocurrencies you should be fully informed of the risks and costs associated with trading the financial markets, carefully consider your investment objectives, level of experience, and risk appetite, and seek professional advice where needed.
Fusion Media would like to remind you that the data contained in this website is not necessarily real-time nor accurate. The data and prices on the website are not necessarily provided by any market or exchange, but may be provided by market makers, and so prices may not be accurate and may differ from the actual price at any given market, meaning prices are indicative and not appropriate for trading purposes. Fusion Media and any provider of the data contained in this website will not accept liability for any loss or damage as a result of your trading, or your reliance on the information contained within this website.
It is prohibited to use, store, reproduce, display, modify, transmit or distribute the data contained in this website without the explicit prior written permission of Fusion Media and/or the data provider. All intellectual property rights are reserved by the providers and/or the exchange providing the data contained in this website.
Fusion Media may be compensated by the advertisers that appear on the website, based on your interaction with the advertisements or advertisers.
© 2007-2025 - Fusion Media Limited. All Rights Reserved.
