Another week gone by and prices continued to climb with the same pattern of small corrections and strong breakouts. It has been a long time since the market managed to make a decent correction (bigger than 5%) and it seems that fear of an impeding big correction feeds the rally. All declining patterns thus far have been corrective (overlapping wave moves or 3 clear waves down) and followed by an upward break out to new highs.
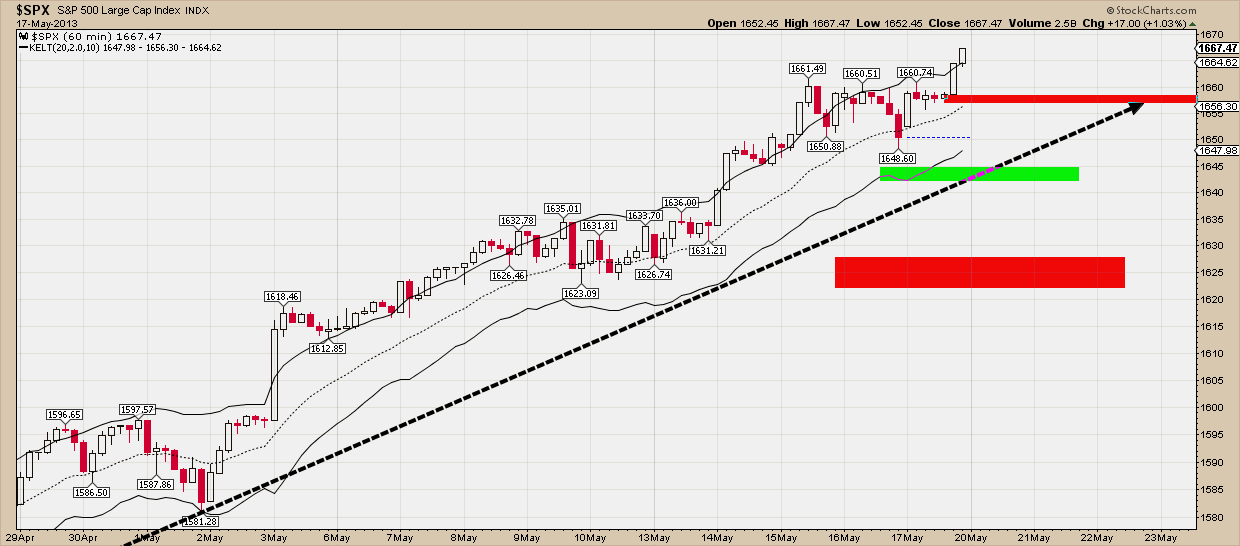
The most recent decline was a 3 wave downward move as can be seen in the following chart. S&P made a low at 1650.88(wave A), then made an upward move at 1660.51 (wave B) and wave C followed to new lows at 1648.60. This pattern was classified as corrective as soon as the intermediate high (wave B) was broken. At that point the scenario of a further decline lost most of its chances relative to the bullish alternate of new highs. All this time we’ve been commenting on the fact that no important support has been broken to put the intermediate trend in danger. Only short term supports were broken but again prices were support by the Keltner channel boundaries. All these are signs of an intact bullish trend that if not followed, could prove very costly to bet against.
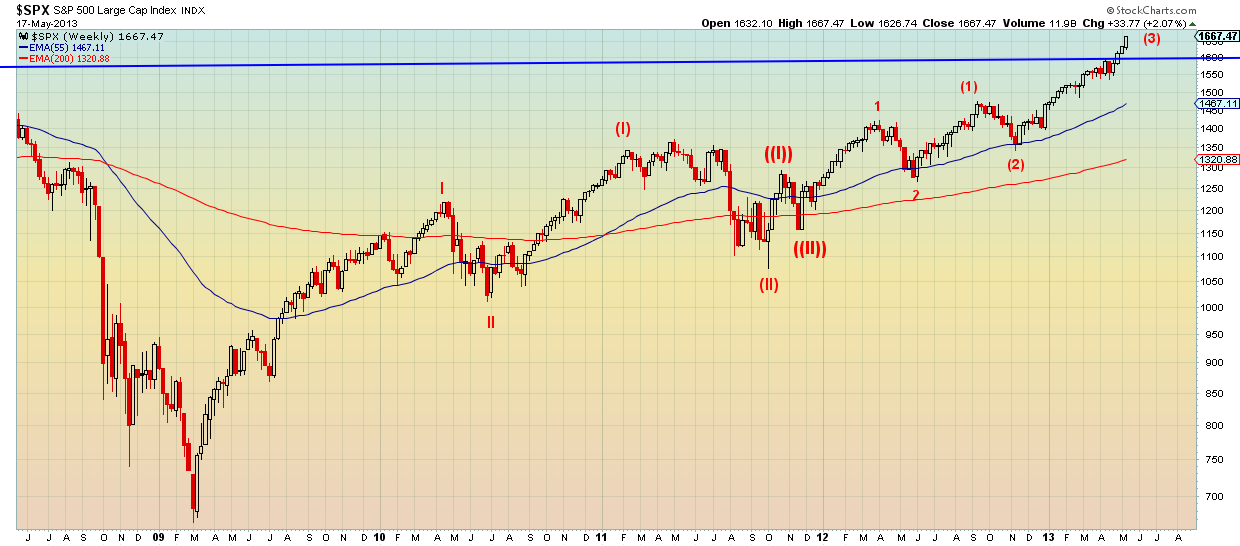
Short term support is found at 1656 and at 1648. The trend remains up and even on the daily chart below, there is no worrying signal that could foretell the end of this move from 1343. Having broken the previous all time high, I favor the bullish scenario that implies we currently are in a new impulsive move that started in 2009.
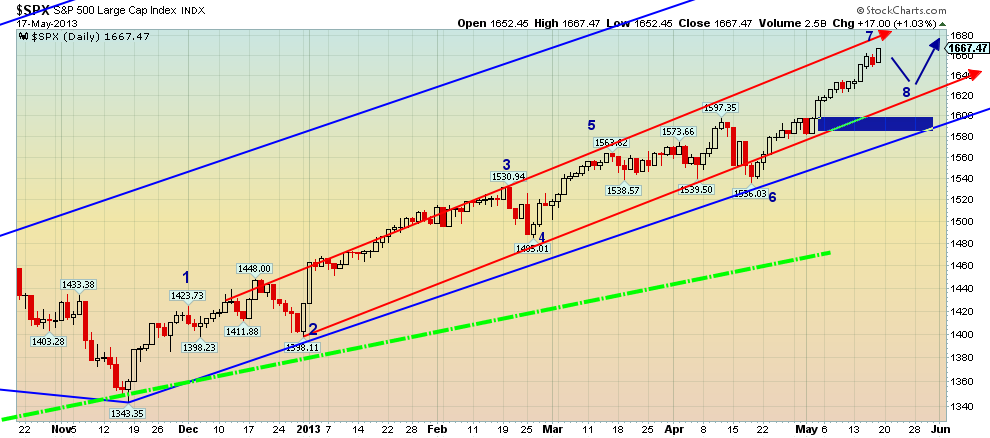
This scenario of course is favored only just because we made a new all time high. Current overlapping pattern from 2009 needs to unfold to a clear impulsive wave in order for this wave count to hold. Now we zoom in the recent price developements and check how the recent price pattern can be counted. In the chart below I just make a note of the waves I notice just by counting them. This could help us determine not only the wave count but if this entire move is impulsive or corrective. As by textbook rules, 9 waves in internal structure is an impulse. Therefore if prices pull back and give a new high, our bullish scenario will become stronger and in turn make our longer term wave count stronger as well.
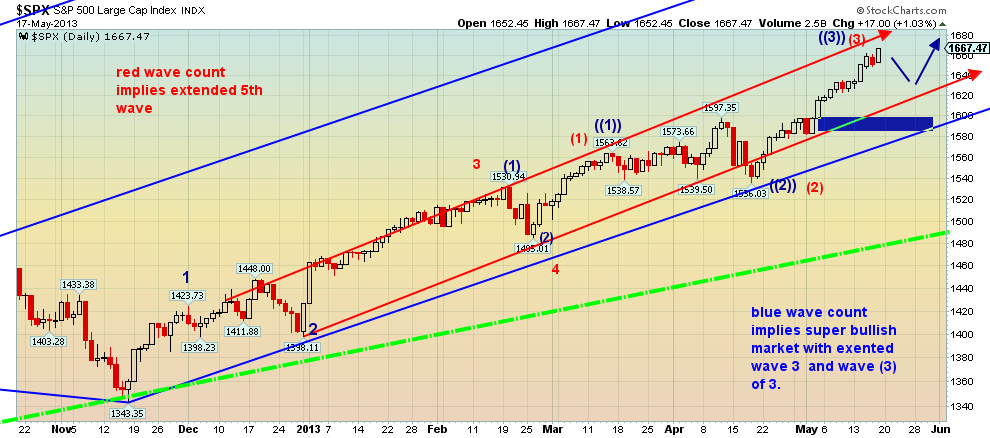
If we try to choose the 2 most possible wave counts for the upward move from 1343, the chart below depicts our two favorite and most probable wave counts. The red count which is our first option implies that we currently trade within an extension of wave 5. The blue wave count implies an even bigger upward potential for the move that started at 1343. For the blue wave count we are still inside wave 3 and its extensions.
We have to note two things regarding these two wave counts and the market behaviour in general. First, everything in life makes cycles. The market as well makes cycles. It cannot move towards one direction all the time. It will make a correction but not when WE want to. That been said, the only thing that could put this wave counts in danger is if prices break below the 1600 level. Secondly, these wave counts are supposed to be a supportive tool in our analysis. Trading with respect to those wave counts needs a lot of expertise and a risk management strategy that should be balanced relative to our risk profile.
Disclosure: None of the information or opinions expressed in this blog constitutes a solicitation for the purchase or sale of any security or other instrument. Nothing in this article constitutes investment advice and any recommendations that may be contained herein have not been based upon a consideration of the investment objectives, financial situation or particular needs of any specific recipient. Any purchase or sale activity in any securities or other instrument should be based upon your own analysis and conclusions.
- English (UK)
- English (India)
- English (Canada)
- English (Australia)
- English (South Africa)
- English (Philippines)
- English (Nigeria)
- Deutsch
- Español (España)
- Español (México)
- Français
- Italiano
- Nederlands
- Português (Portugal)
- Polski
- Português (Brasil)
- Русский
- Türkçe
- العربية
- Ελληνικά
- Svenska
- Suomi
- עברית
- 日本語
- 한국어
- 简体中文
- 繁體中文
- Bahasa Indonesia
- Bahasa Melayu
- ไทย
- Tiếng Việt
- हिंदी
S&P: Fear Feeds Bullish Trend
Published 05/20/2013, 01:37 AM
Updated 07/09/2023, 06:31 AM
S&P: Fear Feeds Bullish Trend
Latest comments
Loading next article…
Install Our App
Risk Disclosure: Trading in financial instruments and/or cryptocurrencies involves high risks including the risk of losing some, or all, of your investment amount, and may not be suitable for all investors. Prices of cryptocurrencies are extremely volatile and may be affected by external factors such as financial, regulatory or political events. Trading on margin increases the financial risks.
Before deciding to trade in financial instrument or cryptocurrencies you should be fully informed of the risks and costs associated with trading the financial markets, carefully consider your investment objectives, level of experience, and risk appetite, and seek professional advice where needed.
Fusion Media would like to remind you that the data contained in this website is not necessarily real-time nor accurate. The data and prices on the website are not necessarily provided by any market or exchange, but may be provided by market makers, and so prices may not be accurate and may differ from the actual price at any given market, meaning prices are indicative and not appropriate for trading purposes. Fusion Media and any provider of the data contained in this website will not accept liability for any loss or damage as a result of your trading, or your reliance on the information contained within this website.
It is prohibited to use, store, reproduce, display, modify, transmit or distribute the data contained in this website without the explicit prior written permission of Fusion Media and/or the data provider. All intellectual property rights are reserved by the providers and/or the exchange providing the data contained in this website.
Fusion Media may be compensated by the advertisers that appear on the website, based on your interaction with the advertisements or advertisers.
© 2007-2025 - Fusion Media Limited. All Rights Reserved.
