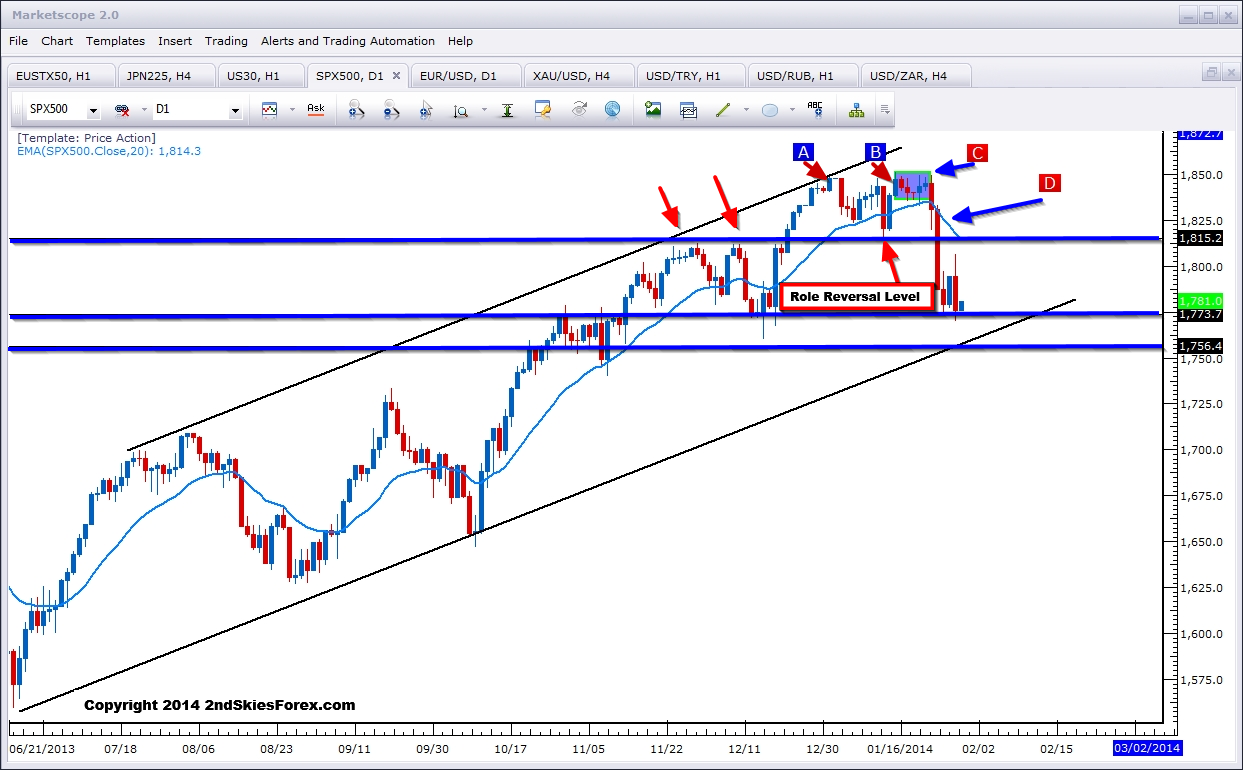
I wanted to write a slightly different market commentary analysis heading into the Chinese New Year (year of the Wood Horse). I am going to do a daily chart price action analysis on the S&P 500 which is showing some kinks in the armor. Before I do, there is a trading maxim which seems appropriate in describing the heavy selling over the last 5 days.
“They take the stairs up, but the elevator down”
Traditionally across all markets,whether it be forex, futures, equities, or commodities – bullish trends tend to take the stairs up, meaning they work their way up slowly. They do this is in contrast to bearish trends which tend to be far more volatile and thus sell off faster.
As a good exercise, take a look over the last 10 years across virtually every asset class, and compare the time it took to form the uptrends vs. how long it took those same uptrends to sell off. Now you understand the maxim.
Back to the S&P 500.
Before we dive into the charts, lets consider the following pieces of data;
1) The S&P 500 ended the year hitting an all time high of 1848. In the first day of trading, the index was heavily sold which I highlighted in the chart below as A. This smells of profit taking from the institutions that were long heading into the new year.
2) The next all time high was made on Jan. 15th at 1851. But the key note on this is, it was an intra-day high as it closed below the 1848 level. This suggested buyers were not able to convince new bulls to come in taking out the all time high (caution). This is marked at B on the chart.
3) The market then danced along this key resistance area between 1848 and 1851 for 5 days. Again, plenty of opportunity for bulls to come in and force an upside breakout. Yet none came. I marked this area C.
4) By Jan 23rd, the markets couldn’t even touch the all time highs, and then sold off taking out the last 6.5 days of gains. If bulls wanted to get in, they had the 1815 level below. But they didn’t. By the next day, the market tumbled through this level selling off almost 40 points and virtually closing on the low (bears in control). I have marked this as D on the chart.
5) As some extra dressing on this picture. Margin usage is at all time highs. The last two times it was this high was in 2000 and 2007 (both before major crisis hit). And as Marc Faber noted in his recent Barron’s interview;
“…statistics show that company insiders are selling their shares like crazy.“
Insiders are selling should be the key thing you note in that sentence. Who are they generally trying to offload their shares to? Retail investors. Food for thought, but lets go back to the chart.
The S&P 500 has broken below the 20ema 5x in the last 6 months with the largest point decline below it being about 72 points, and the smallest being about 30. This current move is about 50 points below it, however it was pretty aggressive compared to the others. It should be noted all prior five breaks came shortly after making new highs or ATH’s (all time highs).
Do I think the trend is over? Possibly, and I am leaning towards that (although I prefer trading with the trend). It should be said in the world of money printing, calling a top can make one look like an idiot.
The scenario I suspect being most likely is a correctional sideways move in the near term. For that reason, I’m looking for selling opportunities. Where? My first level would be around 1812/1815 which is a key role reversal level marked above. Of course any corrective return towards 1845 and I would be a seller as well.
If the bull trend is over, then we should see a LH (lower high) form, with the ideal candidate being that 1812/1815 level. The following price action would need to make new SL (swing lows) below the current monthly lows at 1771, and ideally below the 1759 support level marked above.
A daily close below 1771/72 area will add bearish pressure. A daily close below the 1759 level will likely have bulls seriously concerned (if they are not already). I think one of the last straws would be a closing below the channel in the chart above which has held the price action in play for 7+ months now. That would put 1733 on deck and then 1700 shortly after.
I would like to note that the intra-day charts have shown the bears selling impulsively. Contrast this to any bull rally which has been met with a sharper sell-off, suggesting the bears are coming in with more force and are happy to sell.
Is this potentially the same insiders and institutions selling? Likely. But we need to see more downside carved out before feeling confident this trend is over. Hence my neutral to bearish bias for the rest of the month and to start off February.
If I had one last comment about the upcoming year, it would be that I see 2014 being exponentially more volatile (in markets and geo-politically) than 2013. Volatility is not your enemy as a trader. Traders only say that if they lose money. If they make money, it’s suddenly their friend.
Hence the lesson being – learn how to make money in volatile markets. You can walk away with a stellar year and a ton of money. My suspicions are this year will be one of the most volatile we’ve seen in some time.

