Looking back on the past year there have been no lack of naysayers on the market. At times that could have made sense from a technical perspective. The chart just below of the S&P 500 (SPY) on a monthly timeframe from May of this year is one. The price was up against resistance of a trend line connecting the prior two major tops and extending forward in time. It had also just retraced the entire move lower from the financial crisis. Connecting the lows showed an expanding wedge,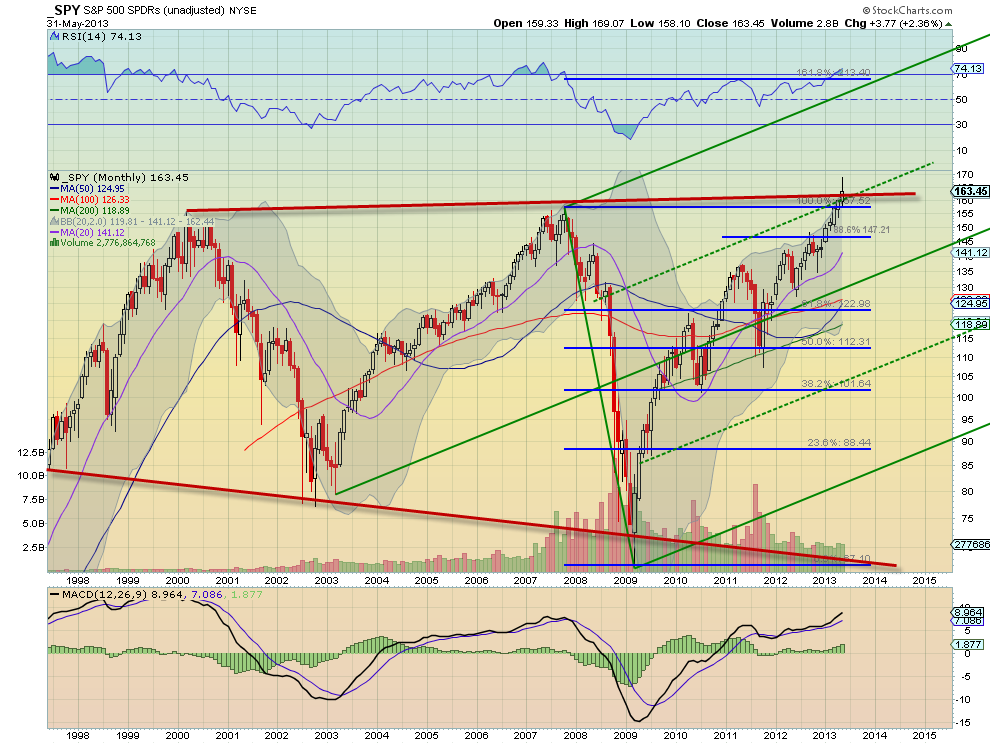
that many, with the other data interpreted as a topping pattern. This was the right time to be cautious about a correction. As you know now 6 months later the top has not yet been found. The S&P 500 has moved well beyond the previous high. I have seen other cyclical interpretations as well, with regard to the percentage moves higher, time periods duplicated, and this year looking like another year. My take is that all of this type of analysis makes for good academic or television discussion but in practical terms it is useless.
First, applying cyclical analysis to long term charts means that you will not know if you are right or wrong for months and possibly years. That is fine, unless you are using actual money to back up your analysis. If you are an academic with a thesis or an author looking for fame in predicting the future then have at it. The S&P 500 chart below is updated through the end of November 2013, but showing a longer time series. The expanding wedge from this perspective can now also be interpreted at a long term consolidation zone after a massive run higher from 100 to 1200. With that lens a continuation on the breakout could targets 2400. It could also pullback and fall thorough the breakout level. But that is not the point. Looking at the wedge in isolation creates a bias simply by not seeing the prior data. You would never interpret the wedge 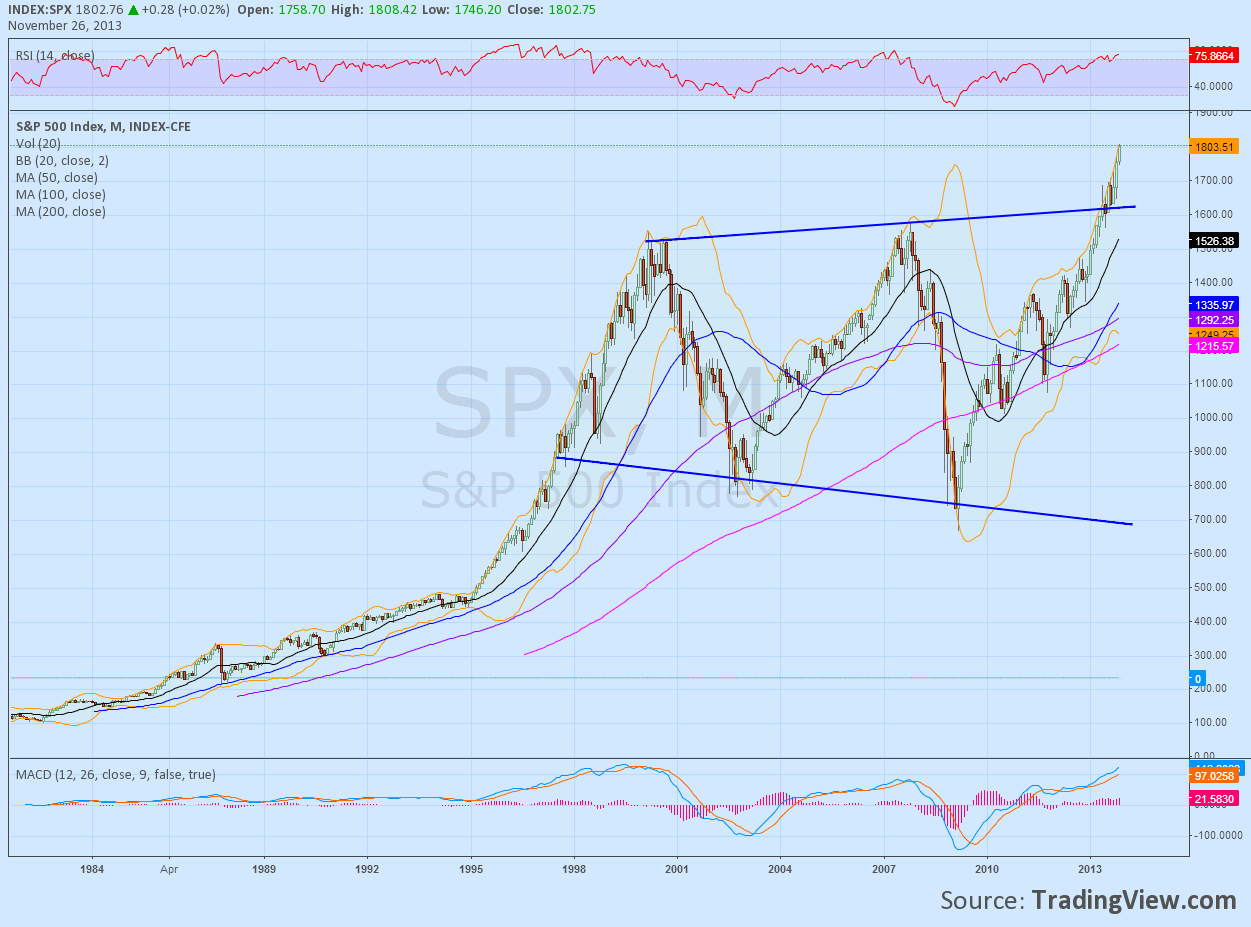
as anything other that a wedge, so not as a consolidation that may continue, without seeing the run up. Second, the application of cyclical terms to the most recent and adjacent 15 years defeats the entire point of looking at cycles. By doing so you have removed over 100 years of history and determined that the only time period that matters is the near past and then, even worse, determined that the future will be based on that short timeframe. The recency bias can then cloud your judgement. Finally, by eliminating all the prior data you now have 1 data point or even by a liberal measure 3 data points. Can you confidently call a cycle on 3 data points?
Cyclical analysis is for looking at long term trends if you are using monthly data and just not useful at points of reflection to determine a short term or intermediate term direction. If you want to try to apply cyclical analysis to the S&P 500 use a much longer data set or look for shorter patterns.
Disclosure: The information in this blog post represents my own opinions and does not contain a recommendation for any particular security or investment. I or my affiliates may hold positions or other interests in securities mentioned in the Blog, please see my Disclaimer page for my full disclaimer.
Original post
- English (UK)
- English (India)
- English (Canada)
- English (Australia)
- English (South Africa)
- English (Philippines)
- English (Nigeria)
- Deutsch
- Español (España)
- Español (México)
- Français
- Italiano
- Nederlands
- Português (Portugal)
- Polski
- Português (Brasil)
- Русский
- Türkçe
- العربية
- Ελληνικά
- Svenska
- Suomi
- עברית
- 日本語
- 한국어
- 简体中文
- 繁體中文
- Bahasa Indonesia
- Bahasa Melayu
- ไทย
- Tiếng Việt
- हिंदी
S&P Analysis: The Folly Of Cyclical Assumptions
Published 11/28/2013, 12:30 AM
S&P Analysis: The Folly Of Cyclical Assumptions
Latest comments
Loading next article…
Install Our App
Risk Disclosure: Trading in financial instruments and/or cryptocurrencies involves high risks including the risk of losing some, or all, of your investment amount, and may not be suitable for all investors. Prices of cryptocurrencies are extremely volatile and may be affected by external factors such as financial, regulatory or political events. Trading on margin increases the financial risks.
Before deciding to trade in financial instrument or cryptocurrencies you should be fully informed of the risks and costs associated with trading the financial markets, carefully consider your investment objectives, level of experience, and risk appetite, and seek professional advice where needed.
Fusion Media would like to remind you that the data contained in this website is not necessarily real-time nor accurate. The data and prices on the website are not necessarily provided by any market or exchange, but may be provided by market makers, and so prices may not be accurate and may differ from the actual price at any given market, meaning prices are indicative and not appropriate for trading purposes. Fusion Media and any provider of the data contained in this website will not accept liability for any loss or damage as a result of your trading, or your reliance on the information contained within this website.
It is prohibited to use, store, reproduce, display, modify, transmit or distribute the data contained in this website without the explicit prior written permission of Fusion Media and/or the data provider. All intellectual property rights are reserved by the providers and/or the exchange providing the data contained in this website.
Fusion Media may be compensated by the advertisers that appear on the website, based on your interaction with the advertisements or advertisers.
© 2007-2025 - Fusion Media Limited. All Rights Reserved.