T2108 Status: 59%
VIX Status: 15.6%
General (Short-term) Trading Call: Hold with a bullish bias
Commentary
Two strange things happened Tuesday: 1) T2108 fell again even as the S&P 500 remained just a few points away from multi-year highs, 2) VXX, the volatility (VIX) ETN, fell significantly again (on high volume) even as the VIX gained slightly.
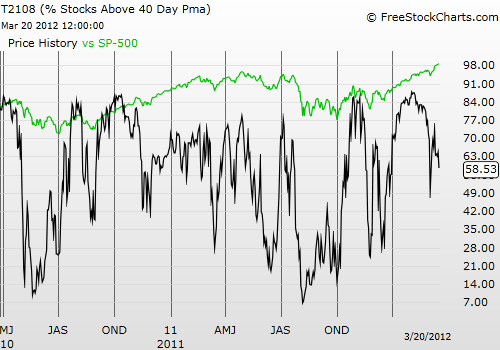
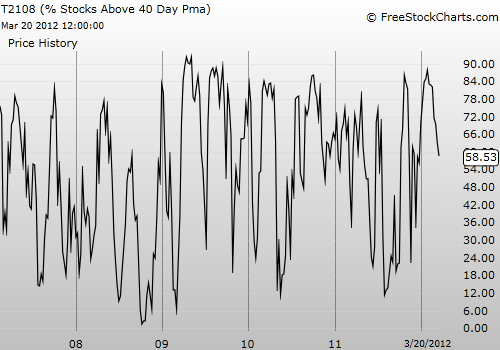
Ever since T2108 finally fell from historic overbought conditions on March 5, the S&P 500 has GAINED 3.0%. T2108 has spent just one extra day in overbought conditions over the two subsequent weeks. Until Tuesday, the S&P 500 GAINED every single day after that 1-day overbought period ended. I consider all this behavior further confirmation of the continuing bullish bias in the market. With T2108 now at 59%, there is plenty of headroom for another return to overbought conditions, not to mention another extended stay as T2108′s history suggests is likely to happen.
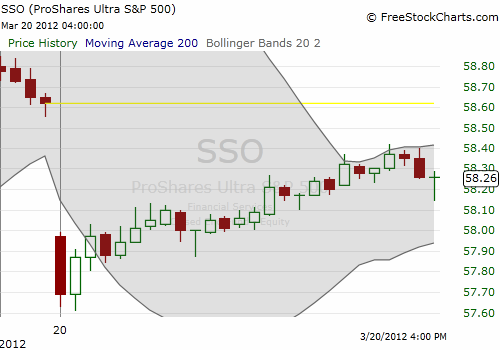
Tuesday delivered the morning drop in the S&P 500 that I was hoping for on Monday. Per current strategy, I targeted a low point for loading up on SSO call options. I thought the S&P 500 might actually reach a 1% loss, but downward momentum soon ended. Once I made that assessment I bought 40% of the SSO calls I wanted and left an order for the remaining 60% at my lower offer. The S&P 500 never looked back for the rest of the day. Here is a 15-minute chart of SSO:

Note well how little time I had to decide to settle for a higher than desired price on the SSO calls. Although I paid more than I wanted, the weekly Mar 23 ’12 $58 calls finished the day 25% higher, making me of course grateful I stuck by the strategy to buy *something* on the dip. I will likely sell these calls on Wednesday given the Friday expiration. Moreover, stochastics on the S&P 500 have flipped firmly overbought making this trade all the more risky or at least tricky. (Recall that in trending markets, stochastics can stay overbought/oversold for extended periods of time).
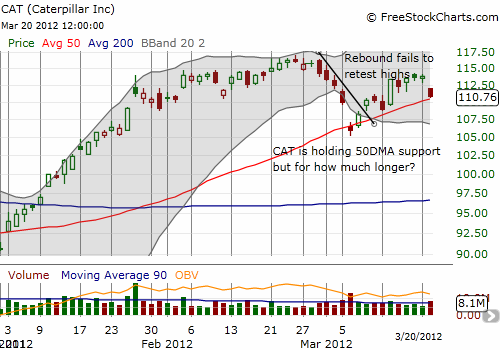
Before I move on to VXX, I want to flag Caterpillar (CAT) as the suspicious character in a room full of bulls. CAT closed down over 2%, finishing the day on top of its 50DMA support on strong selling volume. The stock’s rally now looks increasingly exhausted to me. It failed miserably to re-challenge its all-time highs even as the S&P 500 continued to motor upward. I am taking it off my select list of stocks to buy on dips. In fact, it probably makes sense to aggressively short CAT, particularly as a hedge against other bullish positions. CAT must retake the $114 level to invalidate my growing bearish bias toward it.

I sold my latest round of puts on VXX as it hit fresh all-time lows at $20. VXX went on to lose over 6% on its way to an all-time low of $19.32. My profits from VXX puts are barely keeping up with the losses on the shares. Anyone trying to use VXX to hedge passively or even profit from a major sell-off must be increasingly questioning the decision. I am not sure how much lower VXX needs to go before a climactic (and temporary) bottom gets carved, but it could take a while as a LOT of money has crammed into VXX lately. A lot of heads are likely getting scratched as VXX’s big losses are occurring even as the VIX stabilizes with slight gains. This behavior is a stark reminder of the near uselessness of VXX as a way to play the VIX when it is not trending (strongly) upward. I am assuming that VXX is losing out to a sharp contango condition as its caretakers frantically roll-over volatility futures. For more on this destructive dynamic read “Volatility ETFs Often Own All VIX Futures.” Per current strategy, I will be looking to reload on puts on the next pop in VXX. I will wash, rinse, and repeat as long as VXX keeps sliding on its vicious downtrend. The VXX shares only remain on the books as a “just in case” something crazy happens overnight. VXX, along with SDS, is still enabling me to maintain the conviction to trade aggressively with call options on SSO and certain individual stocks.
Charts below are the latest snapshots of T2108 (and the S&P 500) Refresh browser if the charts are the same as the last T2108 update.

Black line: T2108 (measured on the right); Green line: S&P 500 (for comparative purposes)

VIX Status: 15.6%
General (Short-term) Trading Call: Hold with a bullish bias
Commentary
Two strange things happened Tuesday: 1) T2108 fell again even as the S&P 500 remained just a few points away from multi-year highs, 2) VXX, the volatility (VIX) ETN, fell significantly again (on high volume) even as the VIX gained slightly.
Ever since T2108 finally fell from historic overbought conditions on March 5, the S&P 500 has GAINED 3.0%. T2108 has spent just one extra day in overbought conditions over the two subsequent weeks. Until Tuesday, the S&P 500 GAINED every single day after that 1-day overbought period ended. I consider all this behavior further confirmation of the continuing bullish bias in the market. With T2108 now at 59%, there is plenty of headroom for another return to overbought conditions, not to mention another extended stay as T2108′s history suggests is likely to happen.
Tuesday delivered the morning drop in the S&P 500 that I was hoping for on Monday. Per current strategy, I targeted a low point for loading up on SSO call options. I thought the S&P 500 might actually reach a 1% loss, but downward momentum soon ended. Once I made that assessment I bought 40% of the SSO calls I wanted and left an order for the remaining 60% at my lower offer. The S&P 500 never looked back for the rest of the day. Here is a 15-minute chart of SSO:

Note well how little time I had to decide to settle for a higher than desired price on the SSO calls. Although I paid more than I wanted, the weekly Mar 23 ’12 $58 calls finished the day 25% higher, making me of course grateful I stuck by the strategy to buy *something* on the dip. I will likely sell these calls on Wednesday given the Friday expiration. Moreover, stochastics on the S&P 500 have flipped firmly overbought making this trade all the more risky or at least tricky. (Recall that in trending markets, stochastics can stay overbought/oversold for extended periods of time).
Before I move on to VXX, I want to flag Caterpillar (CAT) as the suspicious character in a room full of bulls. CAT closed down over 2%, finishing the day on top of its 50DMA support on strong selling volume. The stock’s rally now looks increasingly exhausted to me. It failed miserably to re-challenge its all-time highs even as the S&P 500 continued to motor upward. I am taking it off my select list of stocks to buy on dips. In fact, it probably makes sense to aggressively short CAT, particularly as a hedge against other bullish positions. CAT must retake the $114 level to invalidate my growing bearish bias toward it.

I sold my latest round of puts on VXX as it hit fresh all-time lows at $20. VXX went on to lose over 6% on its way to an all-time low of $19.32. My profits from VXX puts are barely keeping up with the losses on the shares. Anyone trying to use VXX to hedge passively or even profit from a major sell-off must be increasingly questioning the decision. I am not sure how much lower VXX needs to go before a climactic (and temporary) bottom gets carved, but it could take a while as a LOT of money has crammed into VXX lately. A lot of heads are likely getting scratched as VXX’s big losses are occurring even as the VIX stabilizes with slight gains. This behavior is a stark reminder of the near uselessness of VXX as a way to play the VIX when it is not trending (strongly) upward. I am assuming that VXX is losing out to a sharp contango condition as its caretakers frantically roll-over volatility futures. For more on this destructive dynamic read “Volatility ETFs Often Own All VIX Futures.” Per current strategy, I will be looking to reload on puts on the next pop in VXX. I will wash, rinse, and repeat as long as VXX keeps sliding on its vicious downtrend. The VXX shares only remain on the books as a “just in case” something crazy happens overnight. VXX, along with SDS, is still enabling me to maintain the conviction to trade aggressively with call options on SSO and certain individual stocks.
Charts below are the latest snapshots of T2108 (and the S&P 500) Refresh browser if the charts are the same as the last T2108 update.

Black line: T2108 (measured on the right); Green line: S&P 500 (for comparative purposes)

