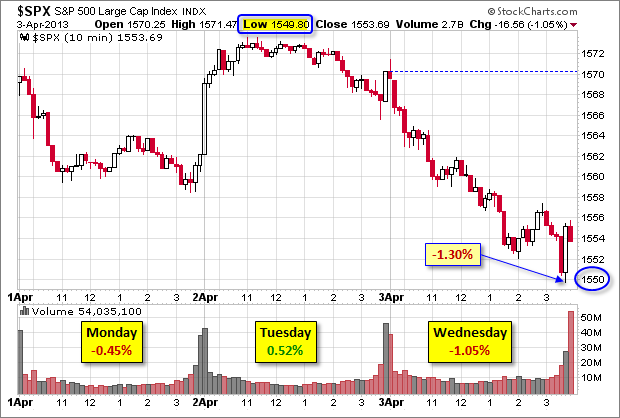
Before the market opened, the ADP Nonfarm Private Jobs Report came in about 20% below consensus estimates. The S&P 500 took that as an initial cue for selling. Thirty minutes into trading, the weaker-than-expected ISM Non-Manufacturing Report didn't help. The selling accelerated to a steady pace through the day to an intraday low, off 1.30%, about 18 minutes before the close. A momentary slip below the 1550 level triggered enough buying to trim the closing loss to 1.05%. That's only the fourth session in 2013 with a one percent plus decline. Is this the beginning the correction that many have been expecting? Much will depend on Friday's jobs report.
Here is a 10-minute look at the week so far.
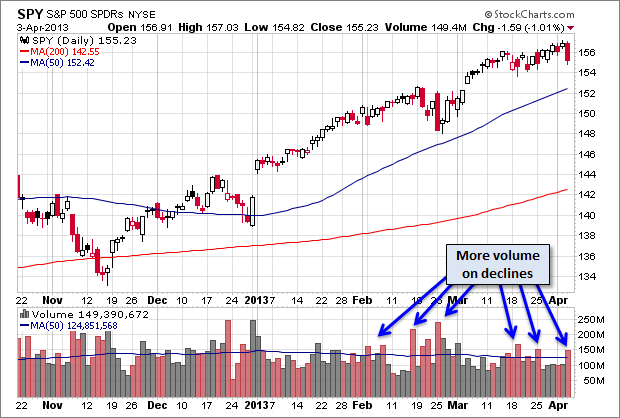
Volume in the index was about 8% above the 50-day moving average. Here a daily chart of the SPY ETF, which gives a better sense of trader mentality. Over the past couple of months, volume spikes have been more associated with declines than advances.
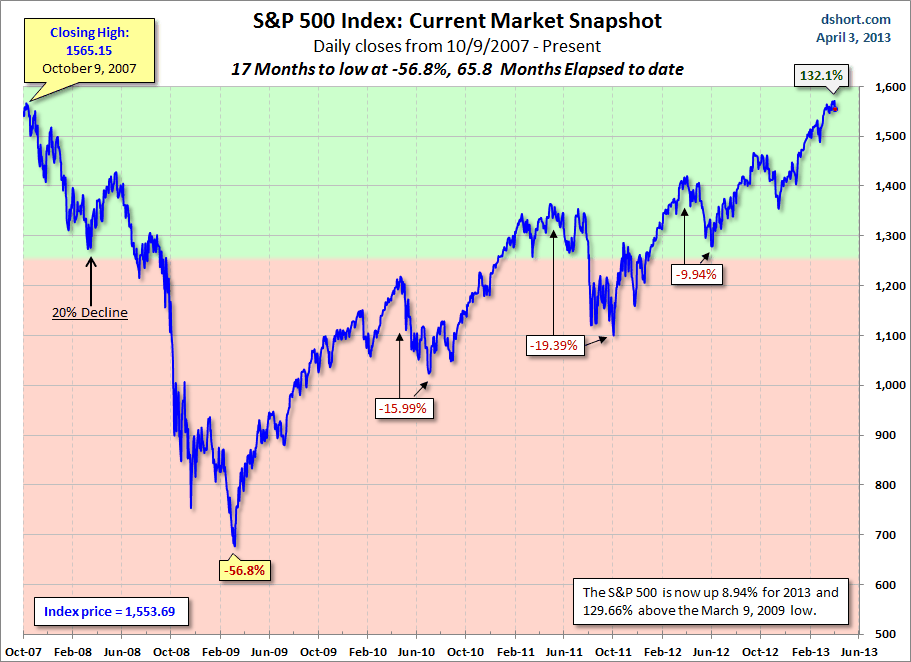
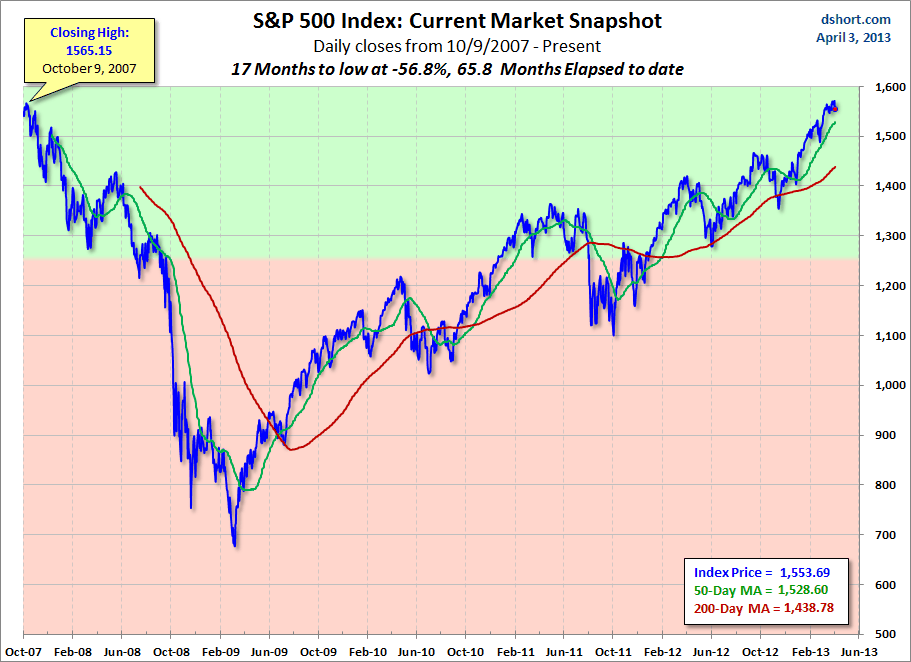
The S&P 500 is now up 8.94% for 2013 and 1.05% below the all-time high set yesterday.
From a longer-term perspective, the index is 129.66% above the March 2009 closing low.

For a better sense of how these declines figure into a larger historical context, here's a long-term view of secular bull and bear markets in the S&P Composite since 1871.
- English (UK)
- English (India)
- English (Canada)
- English (Australia)
- English (South Africa)
- English (Philippines)
- English (Nigeria)
- Deutsch
- Español (España)
- Español (México)
- Français
- Italiano
- Nederlands
- Português (Portugal)
- Polski
- Português (Brasil)
- Русский
- Türkçe
- العربية
- Ελληνικά
- Svenska
- Suomi
- עברית
- 日本語
- 한국어
- 简体中文
- 繁體中文
- Bahasa Indonesia
- Bahasa Melayu
- ไทย
- Tiếng Việt
- हिंदी
S&P 500 Snapshot: Time For A Breather?
Published 04/04/2013, 01:21 AM
Updated 07/09/2023, 06:31 AM
S&P 500 Snapshot: Time For A Breather?
Latest comments
Loading next article…
Install Our App
Risk Disclosure: Trading in financial instruments and/or cryptocurrencies involves high risks including the risk of losing some, or all, of your investment amount, and may not be suitable for all investors. Prices of cryptocurrencies are extremely volatile and may be affected by external factors such as financial, regulatory or political events. Trading on margin increases the financial risks.
Before deciding to trade in financial instrument or cryptocurrencies you should be fully informed of the risks and costs associated with trading the financial markets, carefully consider your investment objectives, level of experience, and risk appetite, and seek professional advice where needed.
Fusion Media would like to remind you that the data contained in this website is not necessarily real-time nor accurate. The data and prices on the website are not necessarily provided by any market or exchange, but may be provided by market makers, and so prices may not be accurate and may differ from the actual price at any given market, meaning prices are indicative and not appropriate for trading purposes. Fusion Media and any provider of the data contained in this website will not accept liability for any loss or damage as a result of your trading, or your reliance on the information contained within this website.
It is prohibited to use, store, reproduce, display, modify, transmit or distribute the data contained in this website without the explicit prior written permission of Fusion Media and/or the data provider. All intellectual property rights are reserved by the providers and/or the exchange providing the data contained in this website.
Fusion Media may be compensated by the advertisers that appear on the website, based on your interaction with the advertisements or advertisers.
© 2007-2025 - Fusion Media Limited. All Rights Reserved.
