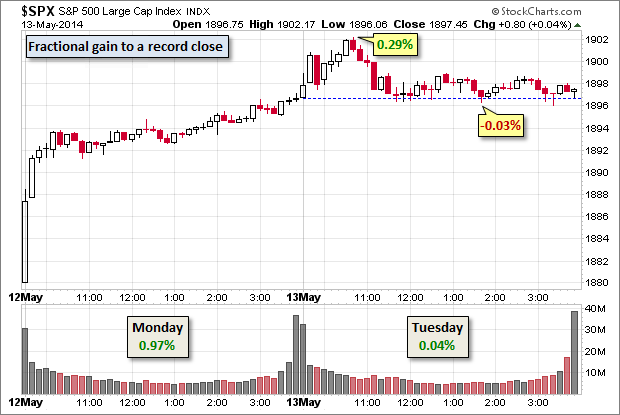
Yesterday morning's report on April Retail Sales was a huge disappointment, but the Standard and Poor's (S&P 500) opened fractionally higher and rose to its modest 0.29% intraday high a little over an hour later. An hour after that erased the gain and began a tightrope walk on Monday's record close. The rest of the day saw an exceptionally narrow trading range, which ended with tiny gain of 0.04%. But any gain would qualify as record close.
Meanwhile, Treasuries rallied. The yield on the 10-year note finished at 2.61%, down 5 basis points (BPS) from yesterday's close and only 1 BP above its 2014 low.
Here is a snapshot of the week so far.

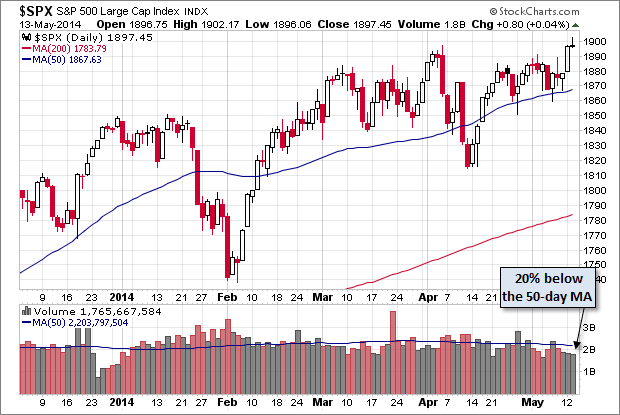
Here's a daily chart of the index. Like Monday, the weak volume documented the relative lack of participation at the current record level. The SPDR S&P 500 Exchange Traded Fund (ETF) (SPY) had even lower volume -- 40% off its 50-day Moving Average (MA).

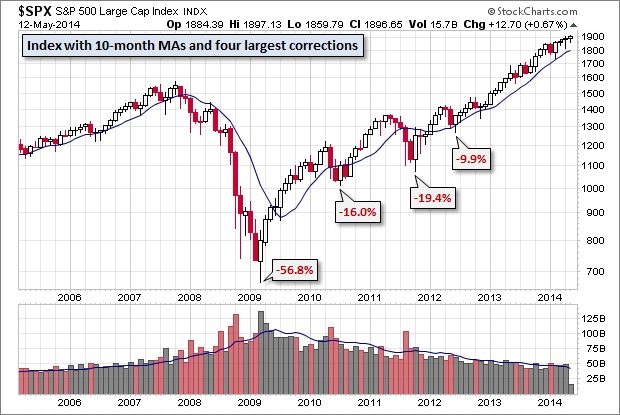
Here is a monthly chart on which I've highlighted the four index declines beginning with the financial crisis trough.

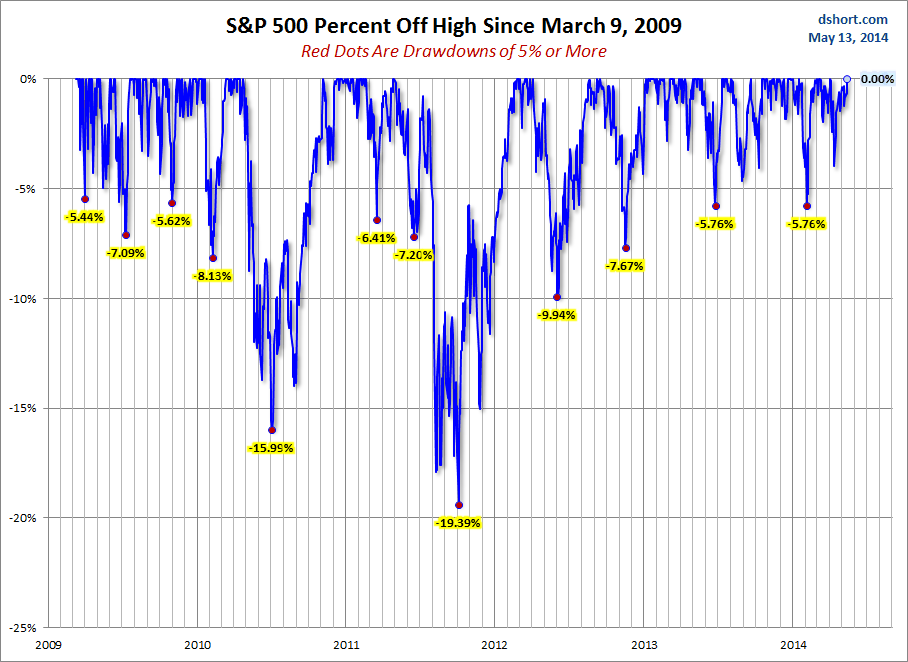
A Perspective on Drawdowns
The chart below uses the percent-off-high strategy for illustrating the drawdowns greater than 5% since the trough in 2009. It's been a while since we've seen anything even vaguely reminiscent of a correction.

