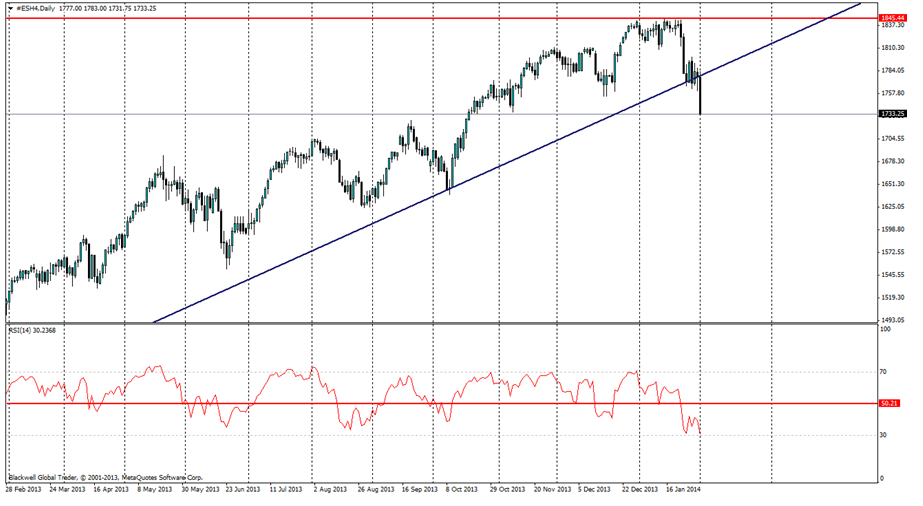
The S&P 500 broke through the last observable trend line on the mini futures chart. This turning point sees the end of the bullish run that has been visible in the last year.
The timing of the fall overnight was caused by the most recent manufacturing data out of the US from the Institute of Supply Management (ISM), which showed a decrease for the previous month to 51.3, while most economists had expected a slight decrease to 56. This shock was apparent on all markets and currencies, but overall a reading of 51.3 still shows expansion as anything above 50 equals expansion in the economy. The nature of the sudden dive though can be attributed to the rocky situation that many people feel may come in the months ahead as US economic data so far has been fairly positive.
Despite the good state of the US economy, a worrying manufacturing reading coupled with the tapering certainly puts pressure on the equity market. Many have long been convinced that the advent of tapering will lead to a loss of liquidity in the current market, and these fears could certainly be flowing through to the market place.
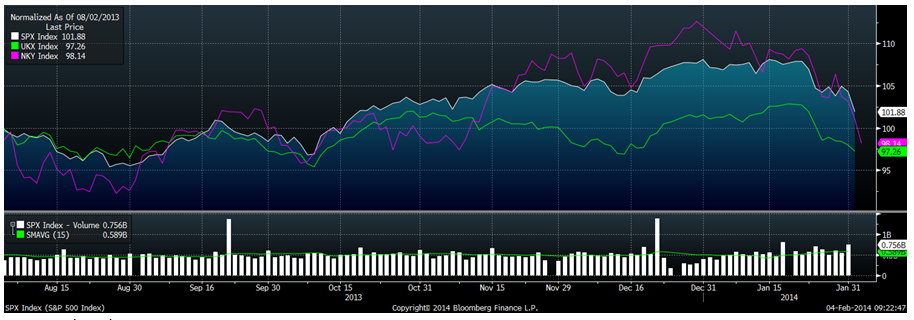
It’s also worth noting that when US equity markets are sick, this trend flows over onto global equity markets and certainly the FTSE and Nikkei have shown the pressure in recent days. I would expect more falls would drag on both major indexes.
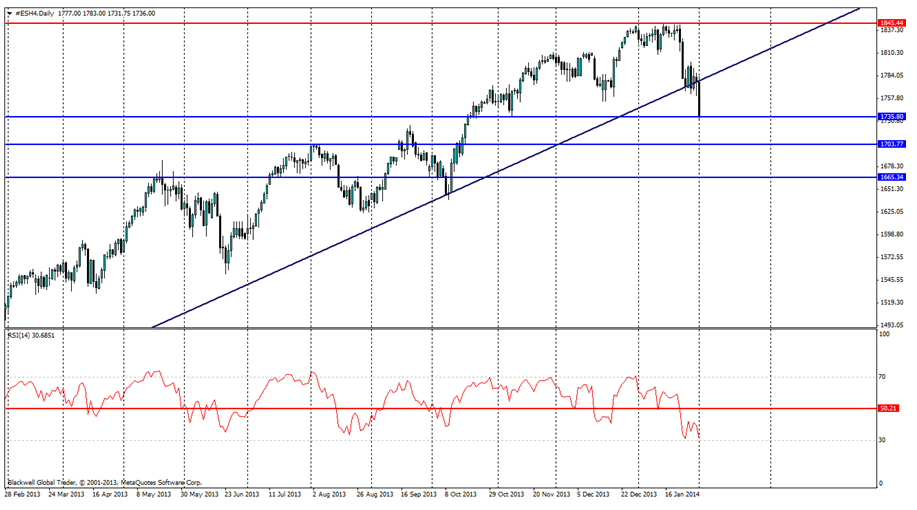
The current market technicals show that resistance can be found at 1845.00, with his level acting as a ceilingon the market. It’s unlikely that this level is going to be tested for some time, due to tapering. However, support levels can be found as the S&P 500 falls further and these can be found at 1735.00, 1703.00 and 1665.00 and are expected to be tested in the coming weeks.However, it may take some time for them to be truly pushed, or a batch of bad economic data.
While the long term outlook has certainly moved away from bullish, and dare say it may be trending towards a bearish outlook, the short term is important to watch as well. Currently, the fall overnight looks to be an over extension of the market, and given the strong support in place and the RSI touching the oversold mark, I would expect to see a pullback in the opening of trading.
Overall, a short term pullback does look possible, but long term, given the recent bad manufacturing data and tapering, it's unlikely that we will see any more upward momentum for the S&P 500. Given this technical breakthrough, coupled with the emerging market crisis we could see more falls in the pipeline. Either way, my outlook has changed from bullish and has now moved towards a more bearish outlook in the long term.
