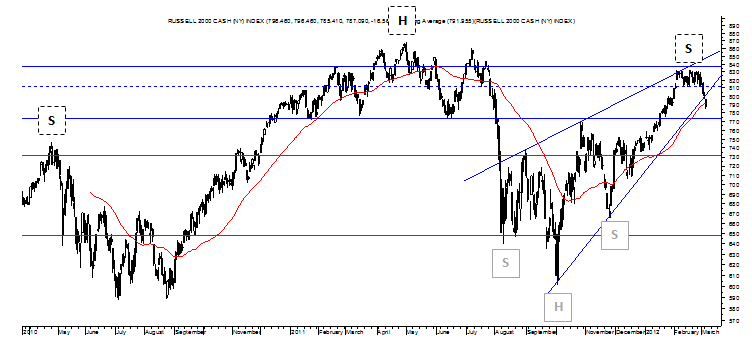
The Russell 2000 started to turn slightly sideways on February 9 as Apple (AAPL) was just starting the most parabolic part of its recent and, perhaps ongoing, parabolic move up and it was at that time that it made sense to write a note titled RUT Struggles to Confirm Its IHS.

It was worth pointing out the fact that the Russell 2000 was balking below the official neckline of its Inverse Head and Shoulders, and the top trendline of its bearish Rising Wedge in blue, considering that the other indices had begun to confirm the IHS pattern showing in each and something that suggested the S&P, Dow and Nasdaq Composite were setting up a 10-15% move up rather than moving down by 15-20% on the aforementioned Rising Wedge.
Not so much with the Russell 2000 as it closed above the neckline of its IHS for just one day and then fell from that ascending trendline to favor, possibly, the bearish Rising Wedge riding on the back of its Inverse Head and Shoulders pattern made bad by October 27’s vision-for-a-plan-to-save-Europe rally.
In so doing the Russell 2000 continued to trade sideways and something that began to reverse its near-term uptrend last week with this small cap index falling below its set of Bear Fan Lines that show a trend reversal to the downside with that nascent reversal made a bit more obvious over the last three trading days and particularly today as the Russell 2000 closed below its 50 DMA.
This cross below its 50 DMA also served to confirm a Rounding Top with a conservative target of 750 and a level below the Russell 2000’s 200 DMA, confirm its bearish Rising Wedge pattern with a target of 602 and cement the right shoulder of this index’s possible Head and Shoulders pattern marked in dashes.
All in all, then, yesterday was a pretty bearish set-up day for the Russell 2000 and one that may provide a bearish blueprint for the other indices that are all still well above the 50 DMA level in each and, in turn, signal that equity indices, and individual securities and ETFs by extension, may head down for a 200 DMA dance at some point in the weeks ahead.
Might this potential 5-10%-type drop in equities happen in one shot in the days ahead and as a reversal to the more bullish nature of January and February? Yes, absolutely, but there’s a good chance it could come in stages too with the Russell 2000 well back within its sideways range and something that is true of the S&P and Dow too.
Relative to the Russell 2000’s sideways range it appears headed to 771 at a minimum but this could translate into something much closer to the middle of its sideways range around 730 to signal that a much bigger bearish drop for equities could be ahead.
Such a signal will be provided, of course, if the RUT remains in a rut in the days and weeks ahead.
