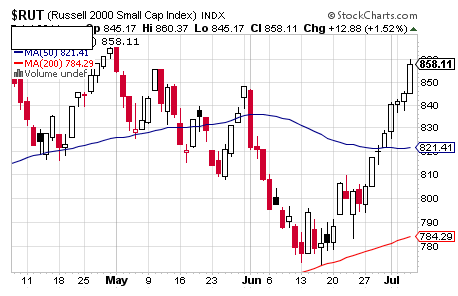
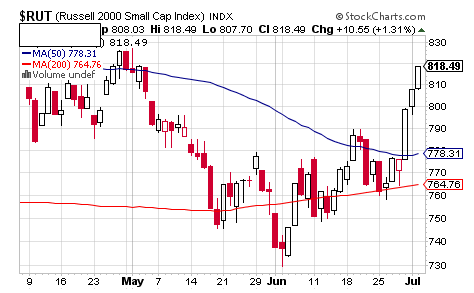
One of these two 3-month daily charts of the Russell 2000 is from April through early July 2011 while the other one is from April through early July 2012 and unless you are familiar enough with the Russell 2000’s levels, it may be somewhat challenging to tell the two trading periods apart.

In the chart above, the Russell 2000 plunged through its 50 DMA, flirted with its 200 DMA only to soar back above both and something that is showing in the chart below too, even though the flirtation was a little heavier with the 200 DMA.

Another similarity is the fact that both charts show this small cap index fulfilling unmarked bullish Falling Wedges with the latter one presenting a decent Symmetrical Triangle that is fulfilling to the upside as a “helper” pattern to the Falling Wedge with a target of about 830.
Based on the truly absurd heights reached by the Russell 2000 last year in the top chart, it seems the Russell 2000 may just put in an equally gravity-defying performance that shows even better in the three-year daily on the following page.
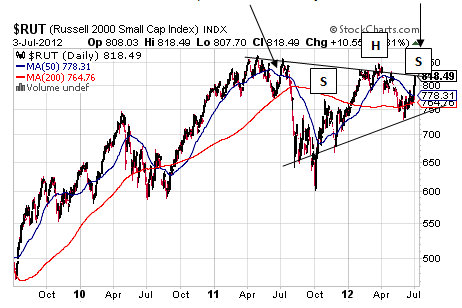
Specifically, the Russell 2000 went a bit vertical to the upside there in 2011 just as it is now here in 2012.

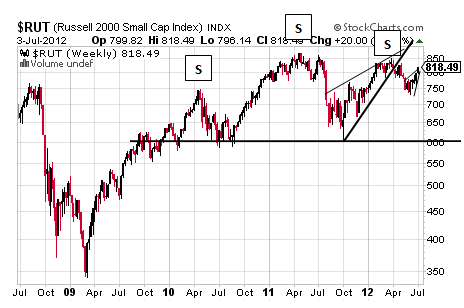
Will the result be the same in a rather equal and opposite way? Based on the oh-so fractal Head and Shoulders pattern that this index has traded into off of an Operation Twist launch, it is fair to believe that, yes, the Russell 2000’s current vertical trajectory up will be matched by something spectacular down and at least to the neckline of that pattern near 760 for a target of 612 and, interestingly, around the neckline of the bigger pattern shown below in the weekly chart below.

It is this pattern that is more perfect with its high second shoulder and straight neckline and it confirms at 602 for a target of 335 and a potential decline of 59%.
Can this pattern be extended-and-pretended away forever? Well it depends on how gullible investors choose to be – again.
But even if lunacy soars to new heights, no, just as the reality behind the first part of the financial crisis here in the US back in 2008, with signs showing as housing topped in the third quarter of 2006 and the credit markets started to crack in the summer of 2007, could not be hidden forever nor will the systemic risks facing the eurozone be held together by Band-Aid-type solutions forever.
Put in another way, the Russell 2000 may or may not crest up a bit higher toward 830 or 840, perhaps it even does what the Dow, Nasdaq Composite and S&P did earlier this year in taking out last year’s highs, but it will fall to its newest Falling Wedge marked in lightly with a target of 730 and to the small H&S with a target of 612 and to the large H&S and its target of 335 to some degree. Timing is the tough part, but with the Russell 2000’s current trend being a directionless sideways trend, it is perilous, perhaps thankless trading it up or down, but particularly up considering how bearish the Russell 2000 is on the reversal of its intermediate-term uptrend along with all of the technical aspects mentioned above.
In fact, it would seem to make more sense to trade the sideways trend to the downside if at all and the most sense to wait for what seems like the inevitable break down.
Such a point seems supported by the fact that it’s tough to tell the Russell 2000’s trading apart in 2011 from 2012 with it being well known what last year brought from its sideways trend.

In the chart above, the Russell 2000 plunged through its 50 DMA, flirted with its 200 DMA only to soar back above both and something that is showing in the chart below too, even though the flirtation was a little heavier with the 200 DMA.

Another similarity is the fact that both charts show this small cap index fulfilling unmarked bullish Falling Wedges with the latter one presenting a decent Symmetrical Triangle that is fulfilling to the upside as a “helper” pattern to the Falling Wedge with a target of about 830.
Based on the truly absurd heights reached by the Russell 2000 last year in the top chart, it seems the Russell 2000 may just put in an equally gravity-defying performance that shows even better in the three-year daily on the following page.
Specifically, the Russell 2000 went a bit vertical to the upside there in 2011 just as it is now here in 2012.

Will the result be the same in a rather equal and opposite way? Based on the oh-so fractal Head and Shoulders pattern that this index has traded into off of an Operation Twist launch, it is fair to believe that, yes, the Russell 2000’s current vertical trajectory up will be matched by something spectacular down and at least to the neckline of that pattern near 760 for a target of 612 and, interestingly, around the neckline of the bigger pattern shown below in the weekly chart below.

It is this pattern that is more perfect with its high second shoulder and straight neckline and it confirms at 602 for a target of 335 and a potential decline of 59%.
Can this pattern be extended-and-pretended away forever? Well it depends on how gullible investors choose to be – again.
But even if lunacy soars to new heights, no, just as the reality behind the first part of the financial crisis here in the US back in 2008, with signs showing as housing topped in the third quarter of 2006 and the credit markets started to crack in the summer of 2007, could not be hidden forever nor will the systemic risks facing the eurozone be held together by Band-Aid-type solutions forever.
Put in another way, the Russell 2000 may or may not crest up a bit higher toward 830 or 840, perhaps it even does what the Dow, Nasdaq Composite and S&P did earlier this year in taking out last year’s highs, but it will fall to its newest Falling Wedge marked in lightly with a target of 730 and to the small H&S with a target of 612 and to the large H&S and its target of 335 to some degree. Timing is the tough part, but with the Russell 2000’s current trend being a directionless sideways trend, it is perilous, perhaps thankless trading it up or down, but particularly up considering how bearish the Russell 2000 is on the reversal of its intermediate-term uptrend along with all of the technical aspects mentioned above.
In fact, it would seem to make more sense to trade the sideways trend to the downside if at all and the most sense to wait for what seems like the inevitable break down.
Such a point seems supported by the fact that it’s tough to tell the Russell 2000’s trading apart in 2011 from 2012 with it being well known what last year brought from its sideways trend.
