💎 Fed’s first rate cut since 2020 set to trigger market. Find undervalued gems with Fair ValueSee Undervalued Stocks

Russell 2000 Taking The Lead

Published 11/29/2017, 09:04 AM
US2000
-

Last week I raised the question, How Strong is the Russell 2000 in this space. It had been the laggard index and looked as if it might be waking up. Since then it flexed its muscles and started a drive higher. It has acted this way in the past, with a strong 6 week run from mid-August to the early October high and plateau. Another 6 week run could easily get to the target mentioned over 161. It has broken out to a new all-time high twice on its way higher already. Today it is worth a look at potential short term resistance points along the way.

The move last week out of the expanding wedge gives a target to near 157. This is also the target looking at the run from the November low into consolidation added to the breakout, like a smaller bull flag. There is plenty of support for this and further upside to continue. The Bollinger Bands® have opened to the upside. The RSI is bullish and rising. It is now on the edge of being overbought but it only takes a look left to the October peak in RSI to see it can go a lot further still. And the MACD is crossed up, positive and rising. It also has a lot of room before it reaches the prior high.
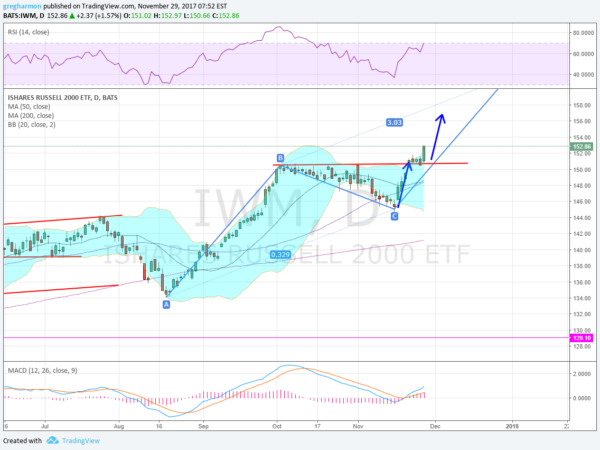
Russell 2000 Daily Chart

Identifying a mosaic of price patterns and indicators all pointing in the same direction can help immensely in finding the strongest trends and gauging when they will end. Keep looking for several reasons in the actual price action to back up your trading capital, not ethereal quantifiers like P/E ratios or the like. Price tells the truth.

The information in this blog post represents my own opinions and does not contain a recommendation for any particular security or investment. I or my affiliates may hold positions or other interests in securities mentioned in the Blog, please see my Disclaimer page for my full disclaimer.

Original post

Latest comments

Loading next article…
Risk Disclosure: Trading in financial instruments and/or cryptocurrencies involves high risks including the risk of losing some, or all, of your investment amount, and may not be suitable for all investors. Prices of cryptocurrencies are extremely volatile and may be affected by external factors such as financial, regulatory or political events. Trading on margin increases the financial risks.
Before deciding to trade in financial instrument or cryptocurrencies you should be fully informed of the risks and costs associated with trading the financial markets, carefully consider your investment objectives, level of experience, and risk appetite, and seek professional advice where needed.
Fusion Media would like to remind you that the data contained in this website is not necessarily real-time nor accurate. The data and prices on the website are not necessarily provided by any market or exchange, but may be provided by market makers, and so prices may not be accurate and may differ from the actual price at any given market, meaning prices are indicative and not appropriate for trading purposes. Fusion Media and any provider of the data contained in this website will not accept liability for any loss or damage as a result of your trading, or your reliance on the information contained within this website.
It is prohibited to use, store, reproduce, display, modify, transmit or distribute the data contained in this website without the explicit prior written permission of Fusion Media and/or the data provider. All intellectual property rights are reserved by the providers and/or the exchange providing the data contained in this website.
Fusion Media may be compensated by the advertisers that appear on the website, based on your interaction with the advertisements or advertisers.
© 2007-2024 - Fusion Media Limited. All Rights Reserved.