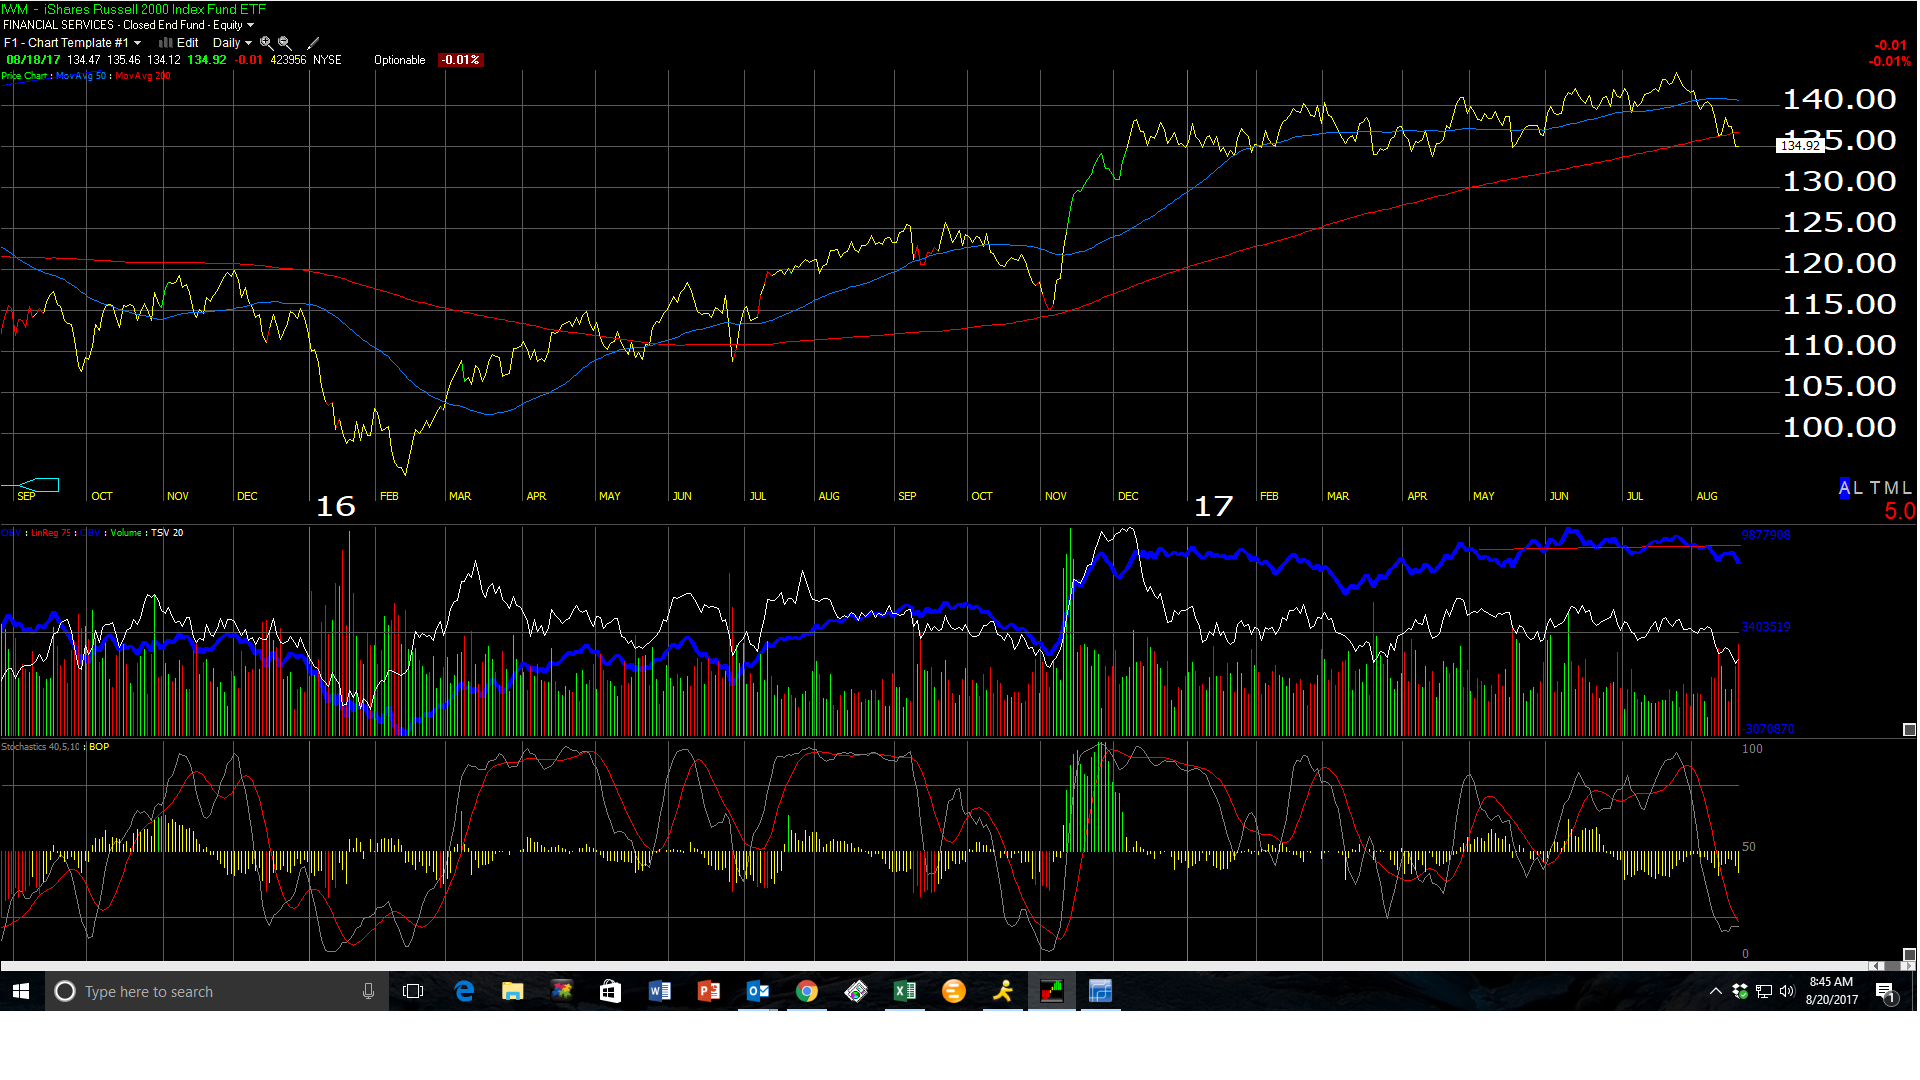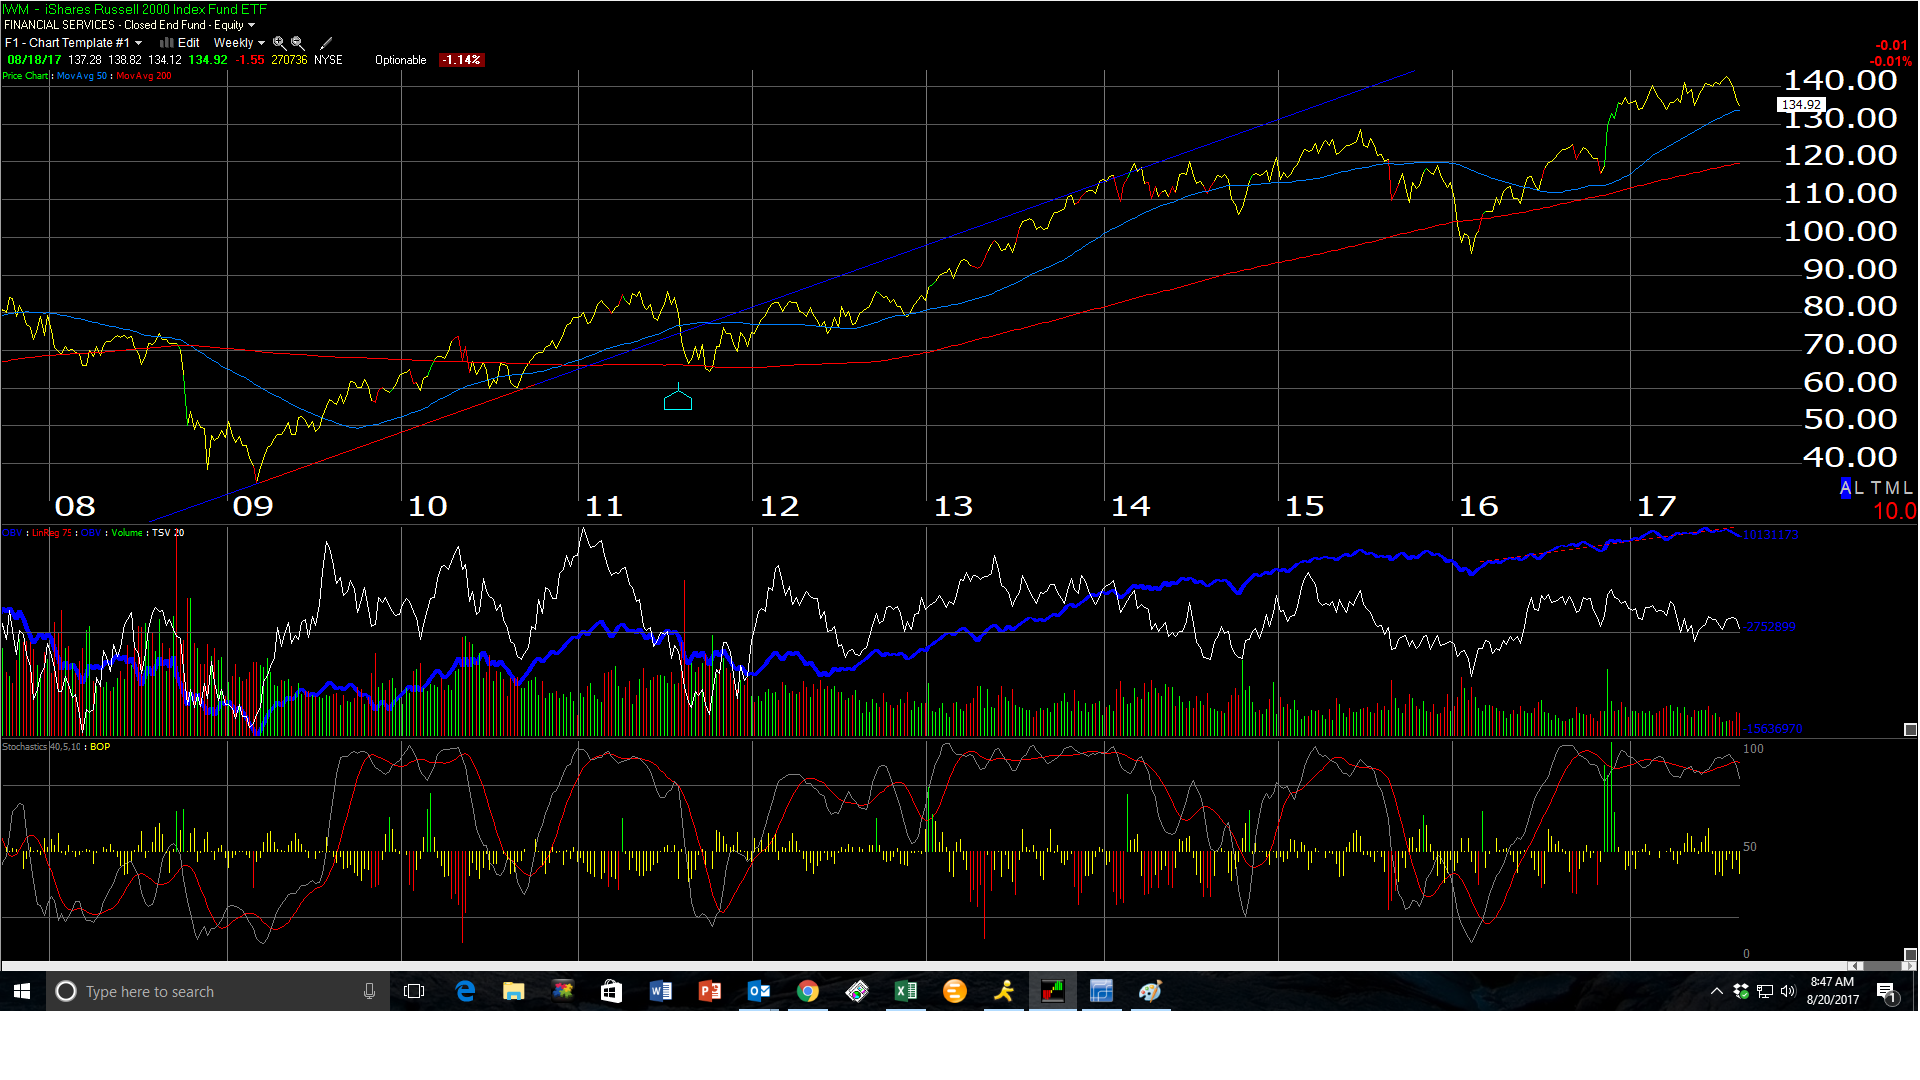

Above are two charts of the Russell 2000 (IWM). The first shows the IWM breaching its 200-day moving average last week, although the bottom of the chart shows the oversold nature of the Russell 2000 today.
The 2nd chart takes a longer look at the Russell 2000 (weekly chart).
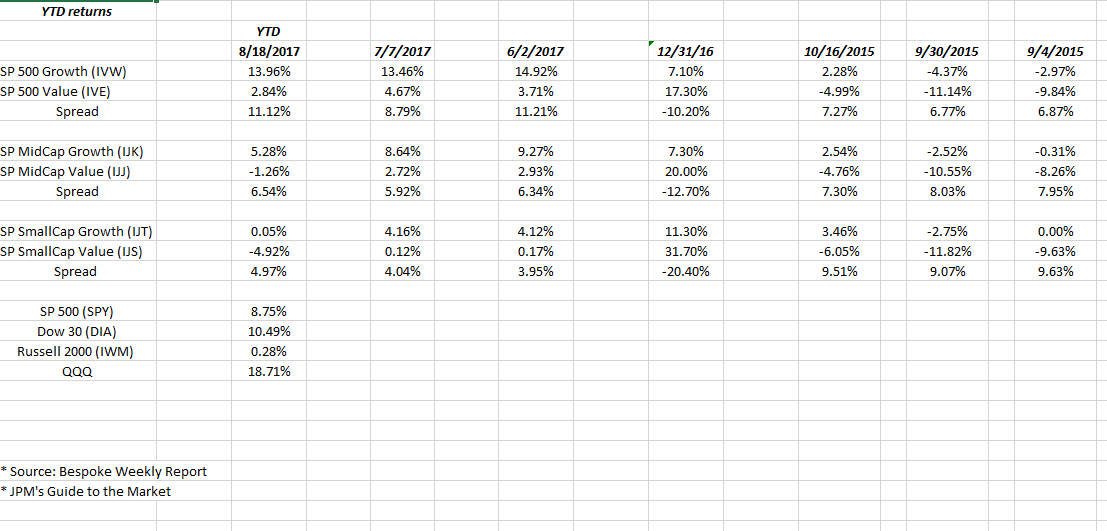
In terms of YTD returns, 2017 has been all about Technology, and large-cap, as the updated spreadsheet shows.

Note how 2017 has turned out to be the exact opposite of 2016 (4th data column) and 2015 was the exact opposite of 2016 and more like 2017.
We’ve had a few years where growth dominated value like 2015 and 2017 and then the opposite happened.
This is known as “style-box” or some might call it “factor” investing, and It is being incorporated more-and-more into client accounts to capture reversion-to-the-mean return. Of course, the downside of this style is a period like we saw from 1995 to 2000 where one sector and one style (i.e. large-cap growth) dominated for such an extended period.
Will the Russell 2000 fold here ? I recently was fortunate enough to get invited to a Strategas Partners presentation here in Chicago where Jason Trennert and a number of his partners talked about the state of the US capital markets. An interesting fact was thrown out from the panel – from Jason, Chris Verrone, Rissmuller, et al.: approximately 1/3rd of the Russell 2000 components are now unprofitable ? The percentage could be higher, but I also could have heard wrong too.
Conclusion: my own experience is that “style-box” trends tend to last for calendar year’s, so the plan today is to stay overweight Tech, but with an eye to add the “value” ETF’s as year-end draws closer. This could change – a lot depends on tax reform and what Congress and the President do in terms of the fiscal agenda, which should benefit large-cap and growth versus small-cap, particularly with a cash repatriation bill.
Personally I’d love to see small-cap’s and the Russell 2000 take a beating in the next few months and then rotate into the asset class.
