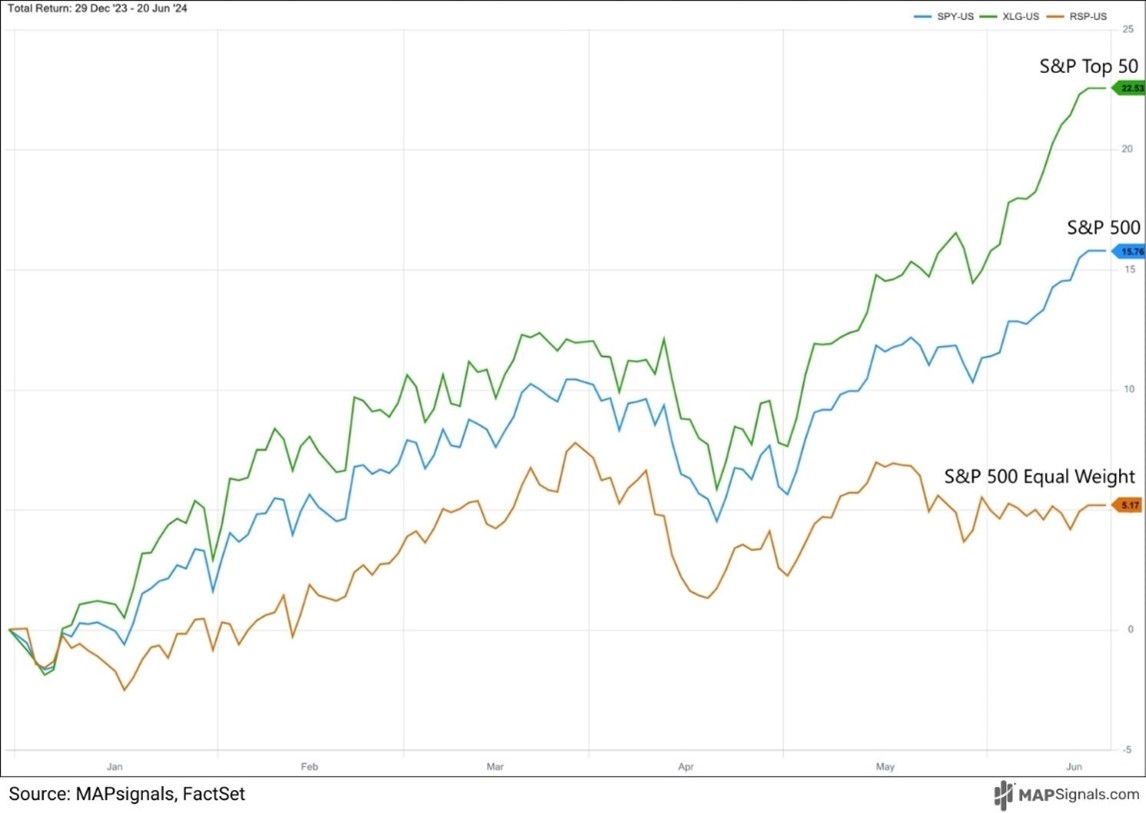
Below we can see how the top stocks in the S&P 500, as tracked by the Invesco S&P 500® Top 50 ETF (NYSE:XLG), have gained 22.5% in 2024. That easily beats the SPDR® S&P 500 (NYSE:SPY) jump of 15.7% and dramatically crushes the RSP YTD performance of +5.1%.

But MAPsignals is all about bringing you evidence-based research that flies in the face of the talking-heads in the media. Before you bail out on your underperforming stocks, have a look at the following pieces of evidence suggesting you should sit tight. And if you’re bold, start buying the beaten-down dogs.
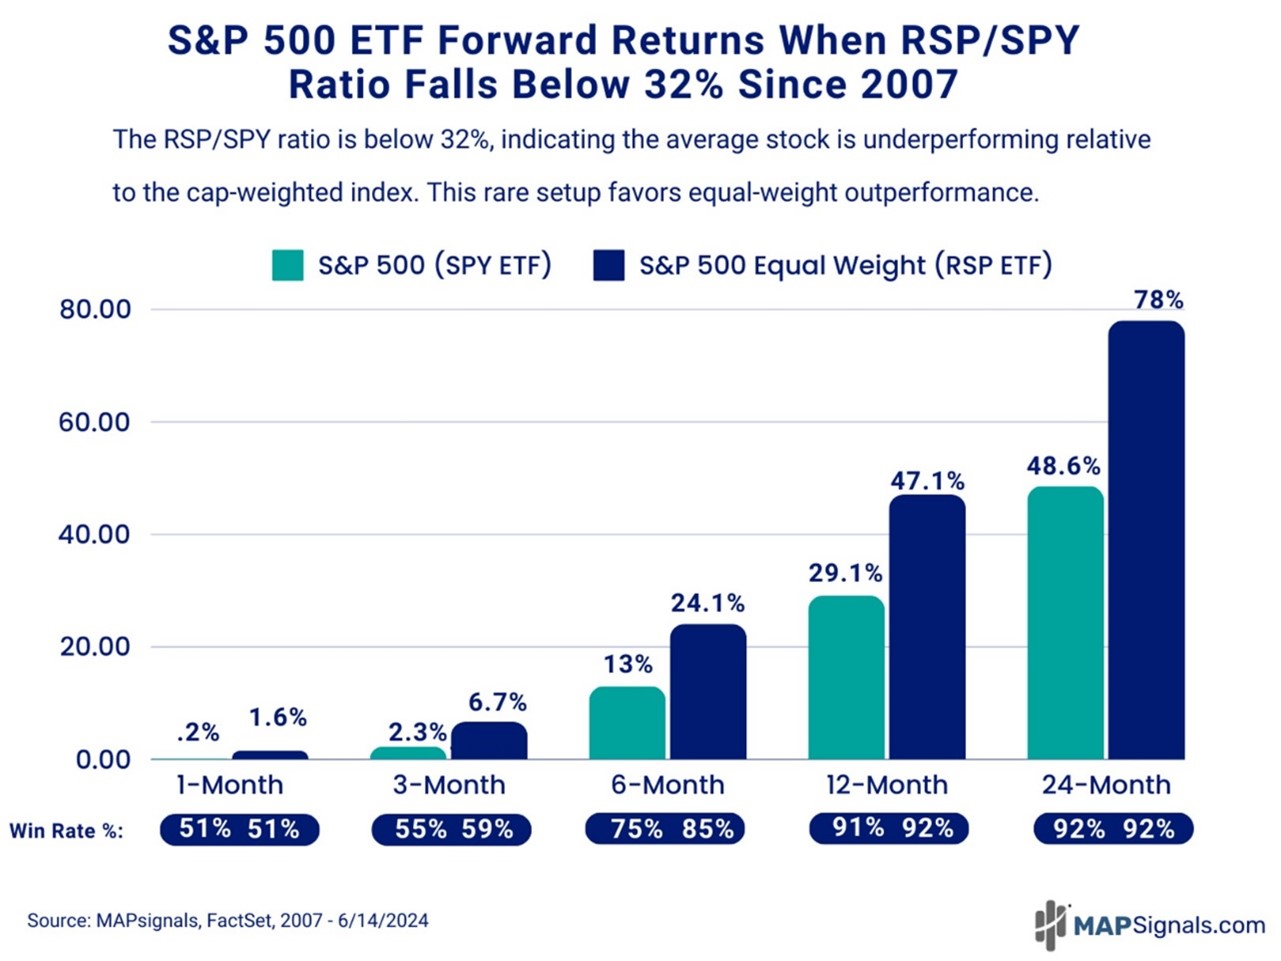
I went back and singled out all days when the RSP/SPY ratio fell below 32%. Basically, I needed to understand what we should expect for stocks going forward. That 32% threshold amounts to 201 trading dates that triggered during the Global Financial Crisis lows, the COVID crash lows, and the relative lows seen recently.
Here’s what happened next: The SPY did just fine. But the RSP was spectacular. When the RSP/SPY ratio fell to 32% or lower since 2007:
- Six months later, the S&P 500 jumped 13% while the S&P 500 Equal Weight basket soared 24.1%
- 12-months later, we saw gains of 29.1% for SPY and 47.1% gains for RSP
- 24-months after, we saw SPY jump 48.6% and RSP catapult 78%

Here’s the bottom line: The stock market rally can keep going. Better yet, all stocks should begin to participate in the coming months…and years. If history is a guide, we will be looking at a monster reversion trade where the equal weighted S&P will play catch up to the market bellwethers.
