Royal Gold (NASDAQ: RGLD) is one of the world’s leading precious metals royalty and stream companies, it’s engaged in the acquisition and management of gold, silver, copper, lead and zinc. The company owns interests on 194 properties in over 20 countries, including interests on 39 producing mines and 21 development stage projects.
During last week, Royal Gold announced fourth quarter dividend of US$0.24 per share of common stock payable on October 20, 2017. It’s stock price closed on Friday at new 5 years high with a total gain of +37% YTD and +250% from last year low.
The recent move higher during the month of August was significantly important for the stocks because the price managed to break above the 2016 peak and that opened a new extension to the upside. So let’s take a look at RGLD technical chart.Royal Gold Elliott Wave Technical Analysis
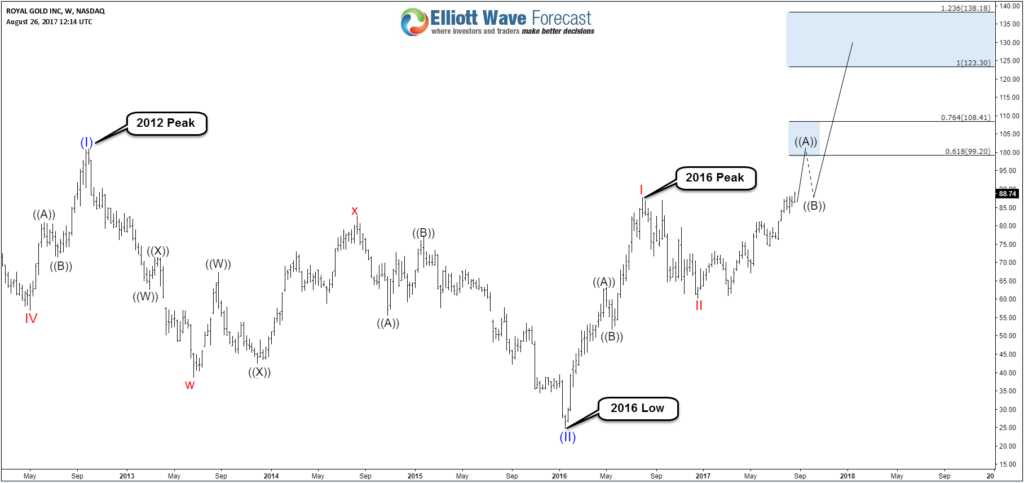
RGLD rallied from 01/20/2016 low before topping at $87.74 on 08/02/2016. That peak held for 1 year in which the stock corrected for 4 months before resuming the move higher and finally managing to break it on 08/10/2017. Royal Gold is now showing an incomplete 5 swings bullish sequence from 2016 low and the stock is expected to continue to the upside toward the minimum target at equal legs area $123 – $138 with a possible extension toward $162.
RGLD Weekly Chart

Using Elliott Wave theory, we can label the move from 2016 low as a start of a 5 waves diagonal so that could be forming wave (III) or only the first leg of it because the 3rd wave usually extend toward the 1.618 fib ext level which will come around $187.
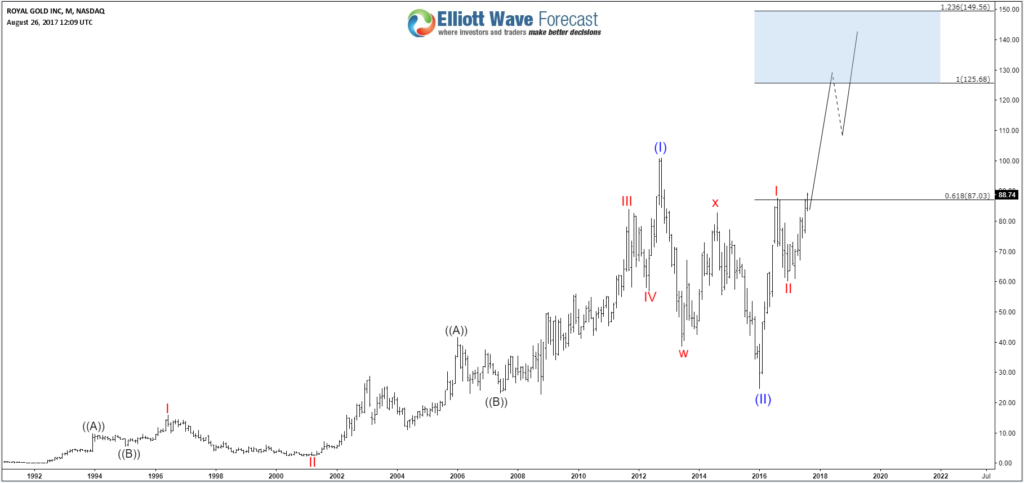
Royal Gold still needs to break above 2012 peak to confirm the bullish move higher and open another bullish sequence. So either way, the move will extend higher as 5 waves or will end up as 3 waves Zigzag ABC from 1991 low. The equal legs from there comes at $125 – $149 which is around the same extreme area from 2016 suggesting that the stock could see a pullback from that area before deciding the next path.
RGLD Monthly Chart

Recap
Royal Gold technical picture is strongly bullish after the recent break higher and that’s why buyers can be seen now during pullbacks in 3, 7 or 11 swings with targets higher above $120 area unless the move higher is part of a flat structure which means it will still do another leg lower against 2016 before rallying again. The stock is getting support from the commodity sector overall and especially of rise in the price of precious metals.
