Ross Stores, Inc. (NASDAQ: NASDAQ:ROST)
Ross Stores, Inc. (ROST), a national off-price retail apparel and home fashion store company yesterday reported their fiscal second quarter 2017 financial results.
Ross reported second quarter earnings of $0.82 per share which beat analyst expectations of $0.76 per share. Ross reported second quarter revenues of $3.43 billion which beat analyst expectations of $3.37 billion.
Ross Stores, Inc. CEO’s Comments
Barbara Rentler, Chief Executive Officer, commented, “We are pleased with the better-than-expected growth we delivered in both sales and earnings in the second quarter, especially given our strong multi-year comparisons and today’s volatile retail climate. Operating margin of 14.9% outperformed our projections, mainly due to a combination of higher merchandise margin and leverage on our above-plan sales gains.”
Ms. Rentler continued, “During the second quarter and first six months of fiscal 2017, we repurchased 3.6 million and 6.9 million shares of common stock, respectively, for an aggregate price of $215 million in the quarter and $430 million year-to-date. As planned, we expect to buy back a total of $875 million in common stock during fiscal 2017 under the two-year $1.75 billion authorization approved by our Board of Directors in February of this year.” Business Wire
ROST Technical Analysis

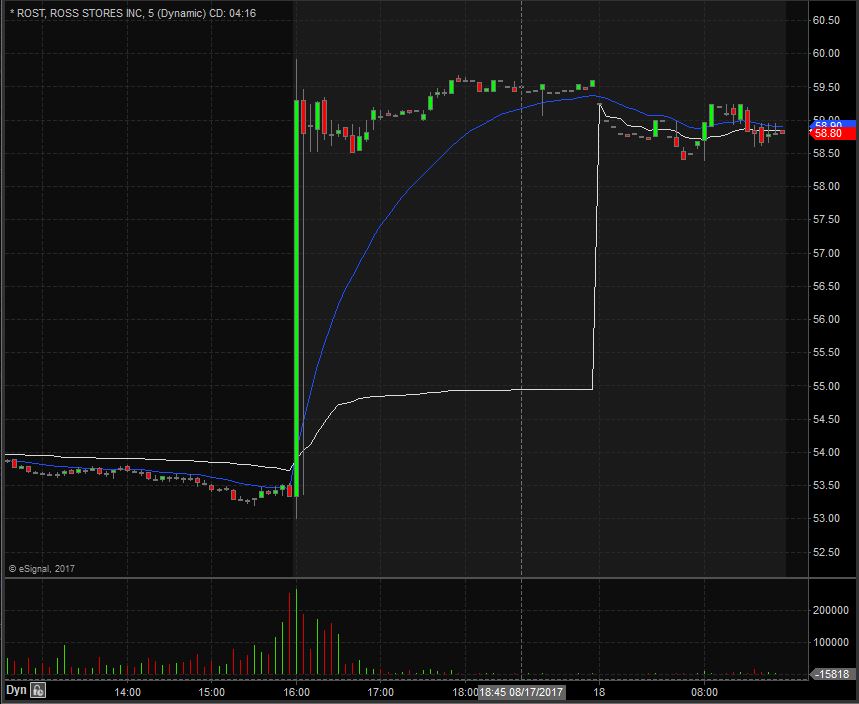
ROST opened trading yesterday at $53.92 which was down from the previous day’s trading close of $54.37. ROST closed trading yesterday at $53.33 and spiked up after market to $59.55, equivalent to a 12% increase from the closing price. Taking a look at the daily chart we can see the last time ROST traded above these levels we have to go back to June 19th when it traded at lows of $60.65.
Taking a closer look at the daily chart we can see that before the spike up ROST had been in an overall downward trend dating back to February 27th when it traded at $69.15. ROST has a float of 380.68 million shares and traded 1.51 times the normal daily trading volume on Thursday.
For trading purposes, I would like to see ROST open trading on Friday above $57.50 and if it does I would be looking to take a long position at the bell. My stop order would be $0.40 from my entry position fearing anything more than that and the stock would start to fill in the gap up.
Company Profile
Ross Stores, Inc., together with its subsidiaries, operates off-price retail apparel and home fashion stores under the Ross Dress for Less and dd’s DISCOUNTS brand names in the United States. It primarily offers apparel, accessories, footwear, and home fashions.
The company’s Ross Dress for Less stores sell its products at savings of 20% to 60% off department and specialty store regular prices primarily to middle income households; and dd’s DISCOUNTS stores sell its products at savings of 20% to 70% off moderate department and discount store regular prices to customers from households with moderate income.
As of July 17, 2017, it operated 1,384 Ross Dress for Less stores in 37 states, the District of Columbia, and Guam; and 205 dd’s DISCOUNTS stores in 16 states. The company was founded in 1982 and is headquartered in Dublin, California.
