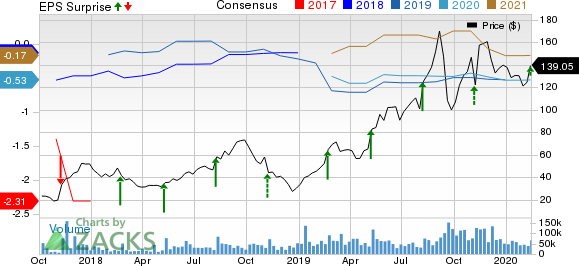
Roku (NASDAQ:ROKU) reported fourth-quarter 2019 loss of 13 cents per share that was narrower than the Zacks Consensus Estimate of a loss of 14 cents. The company had reported earnings of 5 cents per share in the year-ago quarter.
Revenues soared 49.1% from the year-ago quarter to $411.2 million and comfortably beat the consensus mark by 4.8%.
Active accounts jumped 36% year over year to 36.9 million. Streaming hours increased 60% year over year to 11.7 billion. Moreover, average revenue per user (ARPU) grew 29% to $23.14 (on a trailing 12-month basis).
Top-Line Details
Platform revenues (63.1% of revenues) surged 71.5% year over year to $259.6 million.
Robust growth in advertising continued as monetized video ad impressions once again more than doubled year over year, the key catalyst in boosting the top line.
Player revenues (36.9% of revenues) increased 22% from the year-ago quarter to $151.6 million. Player unit sales were up 33% year over year, primarily attributed to growth in core retail channels of the company.
Average sales price (ASP) declined 10% due to the company’s strategy of offering attractive discounts to players.
It witnessed strong unit sales of Roku TV in the reported quarter. The company sold the first onn. Roku TV in Walmart’s (NYSE:WMT) U.S. stores over the Black Friday weekend. Notably, onn. is Walmart’s in-house brand.
The company believes that Roku TV represented more than one in three smart TVs sold in the United States in 2019.
Operating Details
Gross margin contracted 140 basis points (bps) on a year-over-year basis to 39.3%. Decline in ASPs affected the gross margin.
Operating expenses, as a percentage of revenues, increased 480 bps from the year-ago quarter to 43.5%. Growth in headcount and sales & marketing (S&M) expenses led to higher operating expenses.
S&M, research & development (R&D) and general & administrative (G&A) expenses increased 250 bps, 70 bps and 170 bps, respectively.
In the fourth quarter, adjusted EBITDA declined 38.2% year over year to $15.1 million.
Operating loss was $17.4 million in the reported quarter. The company had reported an operating income of $5.5 million in the year-ago quarter.
Balance Sheet & Cash Flow
As of Dec 31, 2019, cash and cash equivalents including short-term investments were $515.5 million compared with $387.5 million, as of Sep 30, 2019.
Guidance
For 2020, Roku expects revenues between $1.58 billion and $1.62 billion. At midpoint, revenues are expected to grow 42% year over year.
Platform segment revenues are expected to represent roughly three-fourth of total revenues.
Gross profit is expected between $720 million and $740 million. At midpoint, gross profit is expected to grow 47% year over year, faster than revenues.
Adjusted EBITDA is expected between ($10 million) and $10 million. Operating expenses on a GAAP basis is expected to be $905 million.
In 2020, Roku plans to continue to add more content to The Roku Channel. The company added more than 40 Premium Subscription channels in 2019 and now offers more than 55 live linear channels.
For first-quarter 2020, Roku expects revenues between $300 million and $310 million. At midpoint, revenues are expected to grow 48% year over year.
Gross profit is expected between $143 million and $148 million. Adjusted EBITDA loss is expected between $18 million and $23 million.
Zacks Rank & Other Stocks to Consider
Roku currently has a Zacks Rank #2 (Buy).
YETI Holdings (NYSE:YETI) and TEGNA (NYSE:TGNA) are a couple of top-ranked stocks in the broader consumer discretionary sector. Both sport a Zacks Rank #1 (Strong Buy). You can see the complete list of today’s Zacks #1 Rank stocks here.
Long-term earnings growth rate for YETI and TEGNA is currently pegged at 17.2% and 10%, respectively.
Looking for Stocks with Skyrocketing Upside?
Zacks has just released a Special Report on the booming investment opportunities of legal marijuana.
Ignited by new referendums and legislation, this industry is expected to blast from an already robust $6.7 billion to $20.2 billion in 2021. Early investors stand to make a killing, but you have to be ready to act and know just where to look.
See the pot trades we're targeting>>
Walmart Inc. (WMT): Free Stock Analysis Report
TEGNA Inc. (TGNA): Free Stock Analysis Report
Roku, Inc. (ROKU): Free Stock Analysis Report
YETI Holdings, Inc. (YETI): Free Stock Analysis Report
Original post

