Riverbed Technology, Inc. (RVBD) has developed solutions to the fundamental problems associated with information technology (IT) performance across wide area networks (WANs).
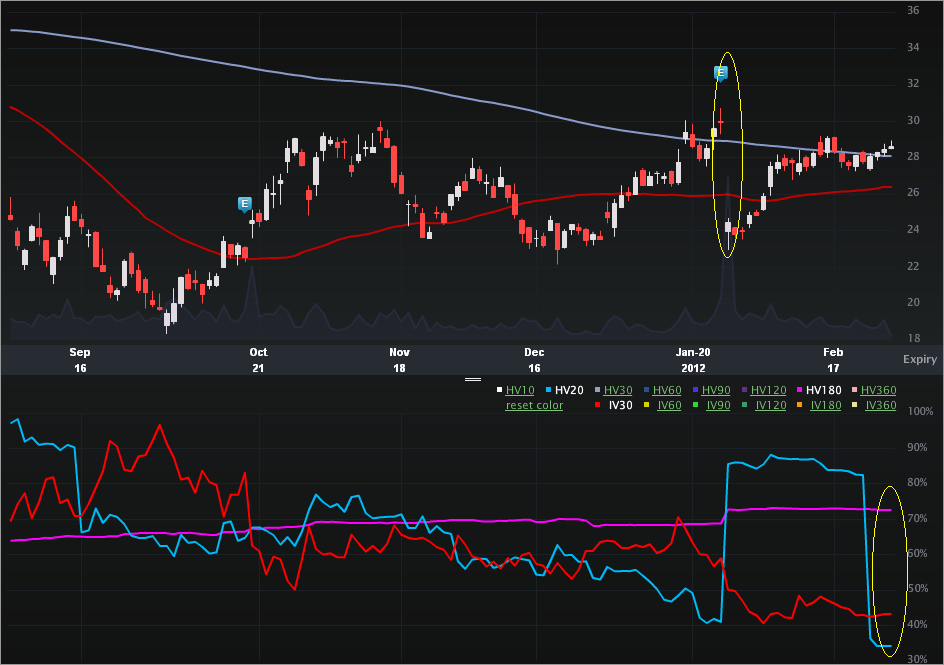
This is a vol note – specifically depressed implied. Let’s turn to the Charts Tab (six months), below. The top portion is the stock price, the bottom is the vol (IV30™ - red vs HV20™ - blue vs HV180™ - pink).
On the stock side, we can see the abrupt drop off of the last earning release.The stock fell from $29.92 to $24.45 or an 18.3% drop. Since then, the stock has risen from that below $25 level to now back over $28.50. On the vol side, we can see the implied has fallen since earnings (as expected), an d remained depressed since then. The 52 wk range in IV30™ for RVBD is [4062%, 96.71%]. The current level put sit in the 5th percentile (annual). It’s this level of the implied that caught my attention.
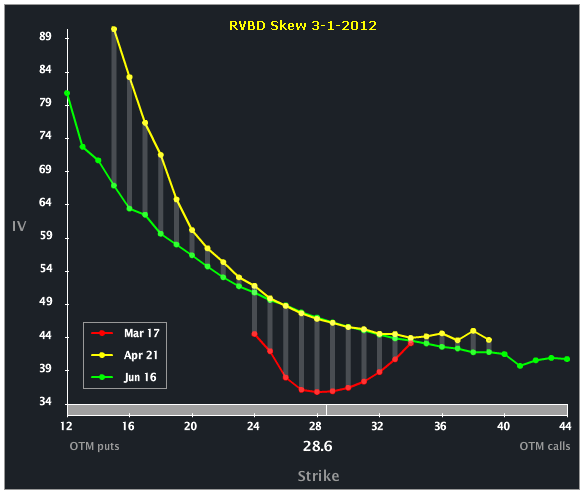
Let’s turn to the Skew Tab to examine the line-by-line and month-to-month vols.
We can see that the front expiry (Mar) is in fact the lowest of the three front months, with Apr (the middle) the highest. For the last two years earnings for RVBD have been on 4-22-1010 and 4-19-2011. Apr options expire this year on 4-20-2012. So, in English, the earnings date as of right now is ambiguous as to which options cycle it falls into. Tricky…
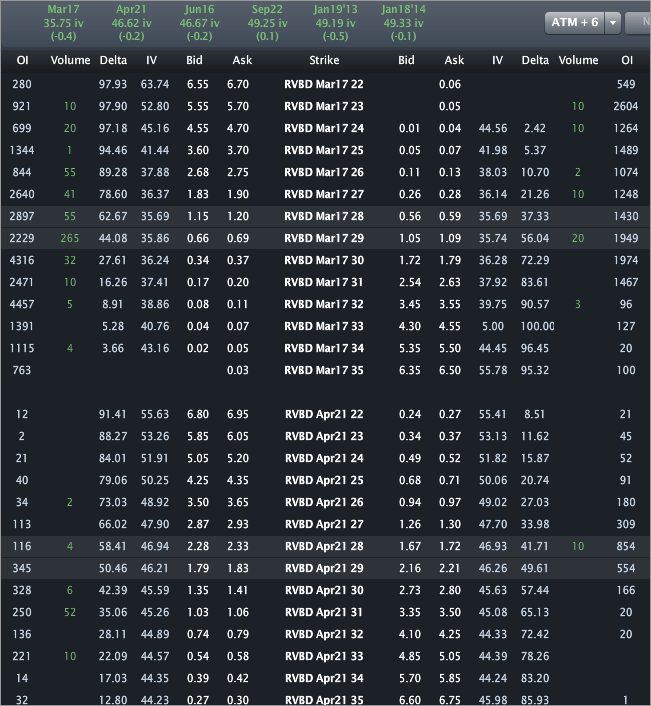
Finally, let’s turn to the Options Tab, for completeness.
I wrote about this one for TheStreet (OptionsProfits), so no specific trade analysis here. Across the top of the Tab we can see 35.75%, 46.62% and 46.67% vols for Mar, Apr and Jun, respectively. That vol in Jun is tasty since we know it has an earnings event embedded. But, if earnings are in Apr, it might be more tasty to examine the Apr options for less premium.
This is trade analysis, not a recommendation.
- English (UK)
- English (India)
- English (Canada)
- English (Australia)
- English (South Africa)
- English (Philippines)
- English (Nigeria)
- Deutsch
- Español (España)
- Español (México)
- Français
- Italiano
- Nederlands
- Português (Portugal)
- Polski
- Português (Brasil)
- Русский
- Türkçe
- العربية
- Ελληνικά
- Svenska
- Suomi
- עברית
- 日本語
- 한국어
- 简体中文
- 繁體中文
- Bahasa Indonesia
- Bahasa Melayu
- ไทย
- Tiếng Việt
- हिंदी
Riverbed Technology: Depressed Vol Nears Annual Low
Published 03/02/2012, 02:44 AM
Updated 07/09/2023, 06:31 AM
Riverbed Technology: Depressed Vol Nears Annual Low
Latest comments
Loading next article…
Install Our App
Risk Disclosure: Trading in financial instruments and/or cryptocurrencies involves high risks including the risk of losing some, or all, of your investment amount, and may not be suitable for all investors. Prices of cryptocurrencies are extremely volatile and may be affected by external factors such as financial, regulatory or political events. Trading on margin increases the financial risks.
Before deciding to trade in financial instrument or cryptocurrencies you should be fully informed of the risks and costs associated with trading the financial markets, carefully consider your investment objectives, level of experience, and risk appetite, and seek professional advice where needed.
Fusion Media would like to remind you that the data contained in this website is not necessarily real-time nor accurate. The data and prices on the website are not necessarily provided by any market or exchange, but may be provided by market makers, and so prices may not be accurate and may differ from the actual price at any given market, meaning prices are indicative and not appropriate for trading purposes. Fusion Media and any provider of the data contained in this website will not accept liability for any loss or damage as a result of your trading, or your reliance on the information contained within this website.
It is prohibited to use, store, reproduce, display, modify, transmit or distribute the data contained in this website without the explicit prior written permission of Fusion Media and/or the data provider. All intellectual property rights are reserved by the providers and/or the exchange providing the data contained in this website.
Fusion Media may be compensated by the advertisers that appear on the website, based on your interaction with the advertisements or advertisers.
© 2007-2025 - Fusion Media Limited. All Rights Reserved.
