Risk-On Trade Is Fading, That’s Bad News For Stocks Short-Term

Published 07/26/2020, 12:27 AM
Updated 11/16/2024, 07:53 AM
HG
-
XBI
-
XLK
-

The risk-on trade may be in serious jeopardy, and that may be bad for the entire market. When digging deeper into ETF trends, it seems that many that have led the market higher are now beginning to roll-over.

The best performing sectors have all been risk-on in sentiment, while anything tied to global growth or risk-off has underperformed. Biotech, Technology, and Semis have all been far and away, the best performing sectors. If these sectors begin to retreat, it likely means the big market rally will turn lower too.

Market Reading Table

Biotech (XBI)

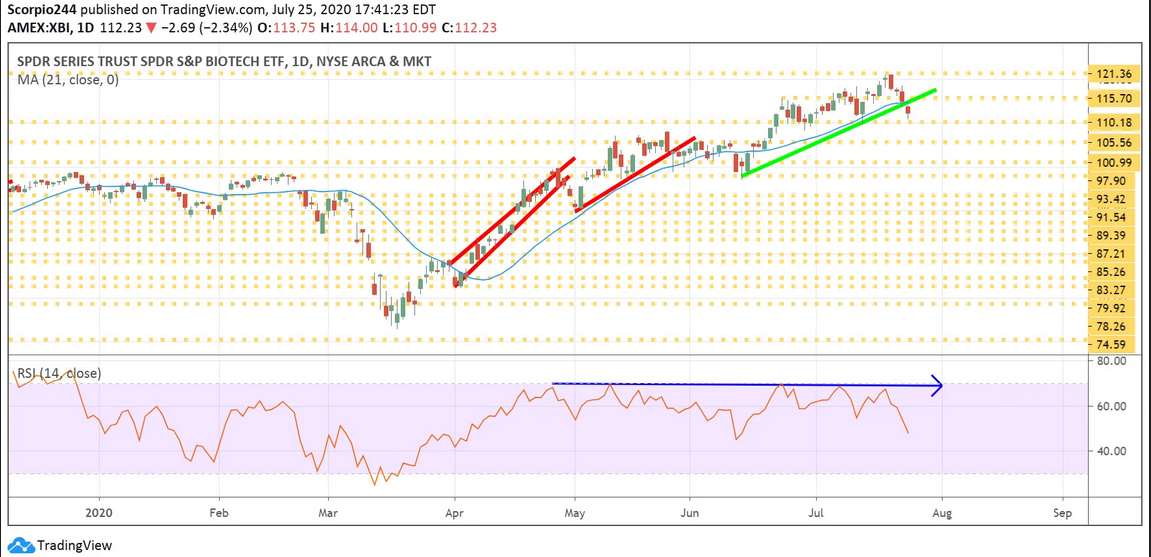
The XBI has been the winner this year, rising by 18%. They’re now two bearish signals that have been presented. First, the relative strength has flatlined since April, despite the ETF rising to record highs, a bearish divergence. Now for the first time, we are seeing the RSI sink, and that would suggest that all that bullish momentum is leaving the ETF and sector.

Additionally, the ETF has now broken a significant uptrend, a drop below $110 likely triggers a deeper move to $105 or less.
SPY-ETF Daily Chart

Technology (XLK)

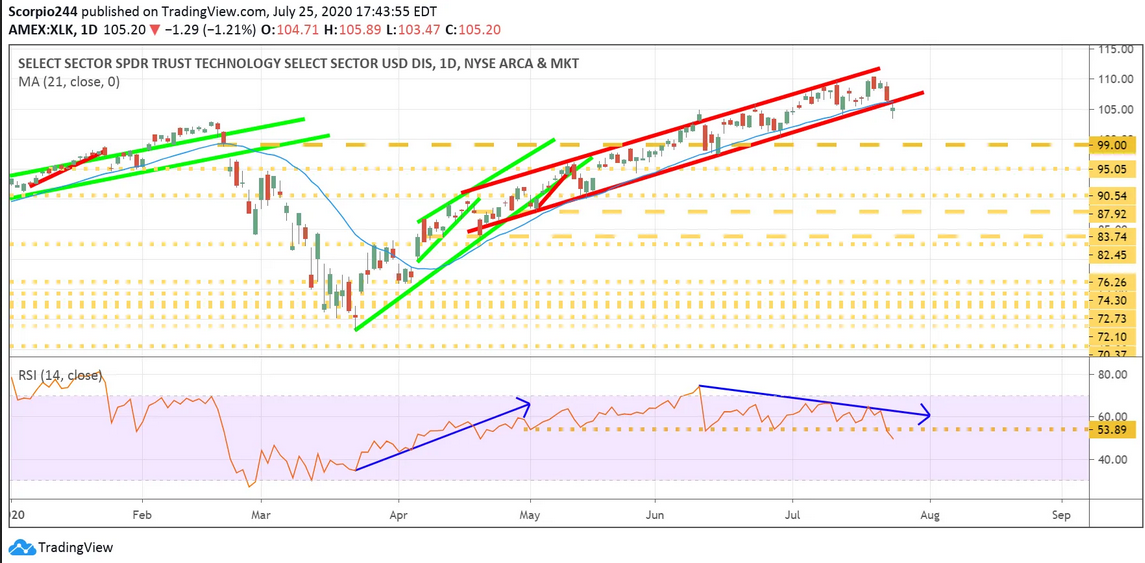
The technology ETF XLK has risen by almost 15% this year. It, too, has a bearish divergence in the RSI, which has now fallen to the lowest level in some time. Additionally, like the XBI, the XLK has broken an enormous uptrend that has been in place since mid-April. Based on the current set up, it appears the ETF could fall to around $99.
XLK Daily Chart

Semis (SMH)

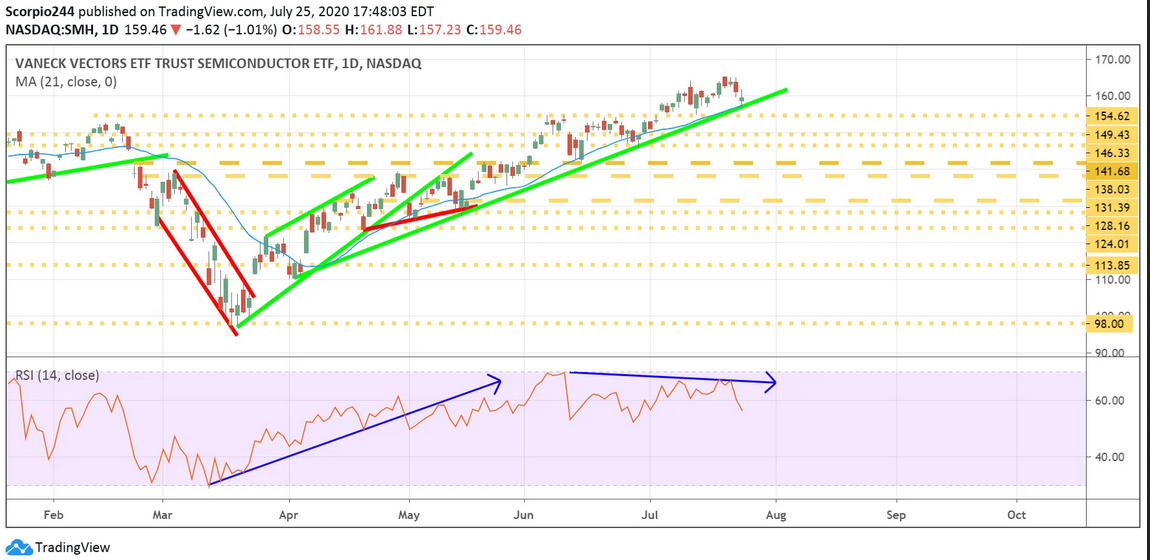
The SMH ETF is also flashing the same bearish divergence on the RSI, but it is yet to break the uptrend. With the potential to drop to around $149.
SMH Daily Chart

Cooper

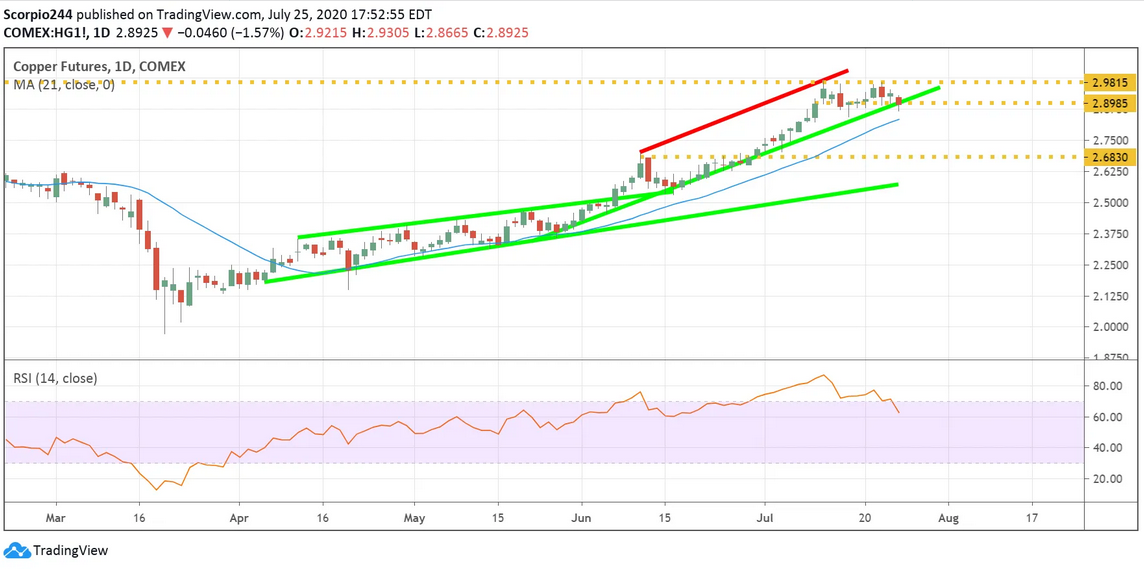
Meanwhile, copper prices have been weakening and showing many of the same characteristics as the sector listed above, with a chance for the metal to fall to around $2.65.
Copper Futures Daily Chart

10-Year Yields

We have seen a big move lower in yields, with the 10-Year testing support around 55 bps. A break below that support sends yields to around 35 bps.
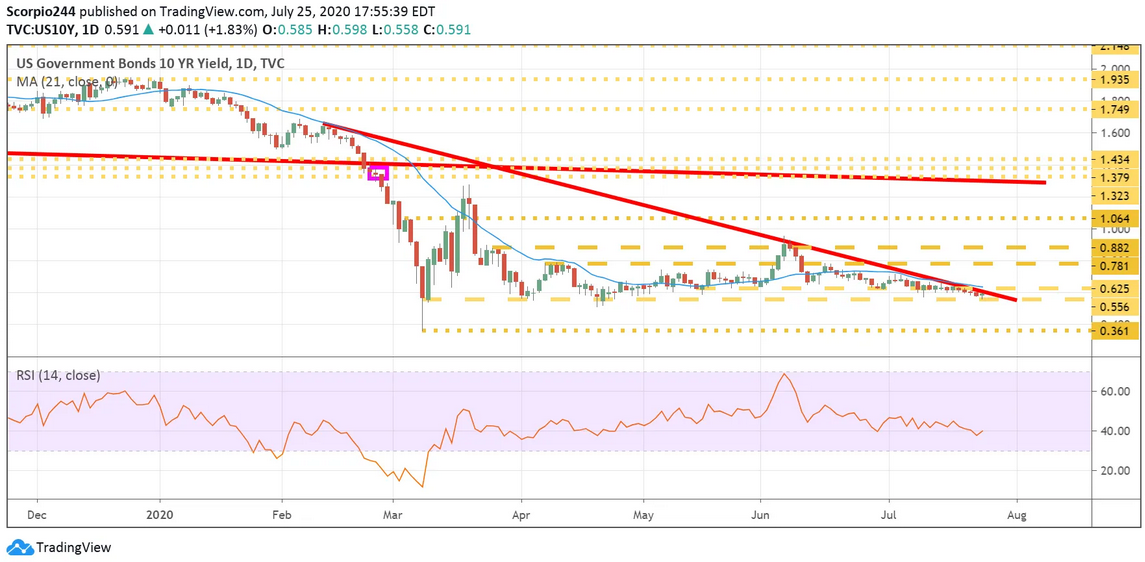
10 Yr Yields Daily Chart

Finally, the high yield ETF HYG could be on its way back to $80.50.
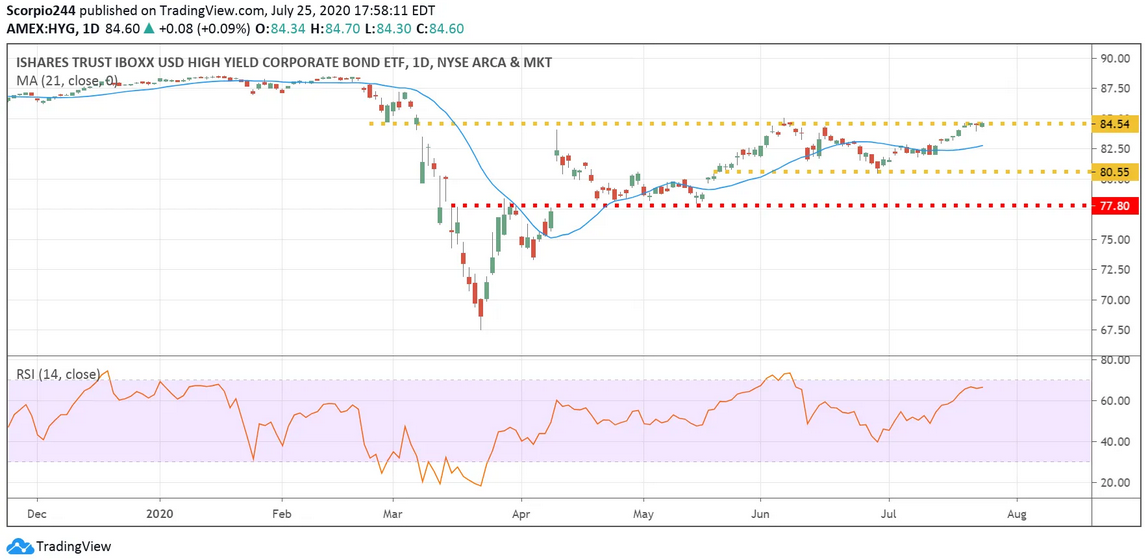
HYG ETF Daily Chart

Just keep an eye on these, they will tell you the direction of the markets next move.

Original Post

Latest comments

Loading next article…
Risk Disclosure: Trading in financial instruments and/or cryptocurrencies involves high risks including the risk of losing some, or all, of your investment amount, and may not be suitable for all investors. Prices of cryptocurrencies are extremely volatile and may be affected by external factors such as financial, regulatory or political events. Trading on margin increases the financial risks.
Before deciding to trade in financial instrument or cryptocurrencies you should be fully informed of the risks and costs associated with trading the financial markets, carefully consider your investment objectives, level of experience, and risk appetite, and seek professional advice where needed.
Fusion Media would like to remind you that the data contained in this website is not necessarily real-time nor accurate. The data and prices on the website are not necessarily provided by any market or exchange, but may be provided by market makers, and so prices may not be accurate and may differ from the actual price at any given market, meaning prices are indicative and not appropriate for trading purposes. Fusion Media and any provider of the data contained in this website will not accept liability for any loss or damage as a result of your trading, or your reliance on the information contained within this website.
It is prohibited to use, store, reproduce, display, modify, transmit or distribute the data contained in this website without the explicit prior written permission of Fusion Media and/or the data provider. All intellectual property rights are reserved by the providers and/or the exchange providing the data contained in this website.
Fusion Media may be compensated by the advertisers that appear on the website, based on your interaction with the advertisements or advertisers.
© 2007-2025 - Fusion Media Limited. All Rights Reserved.