US Treasuries benefit from safe haven flows
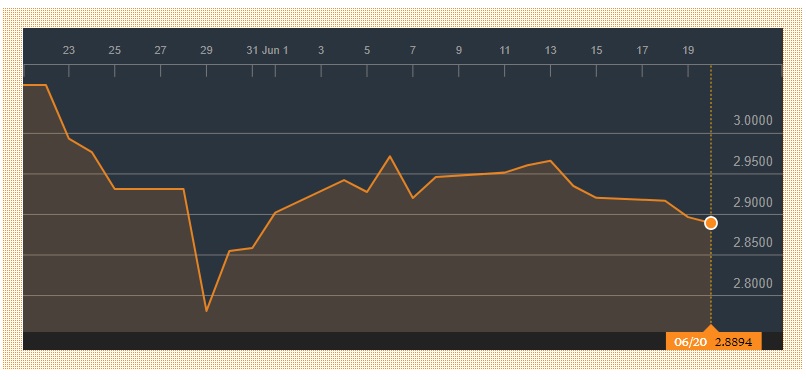
The escalating trade war between the two economic superpowers, US and China, continues to weigh on investor sentiment. Safe haven flows from both equities and currencies are targeting longer-dated US Treasuries, pushing the 10-year US yield below 2.90% for the first time this month. As Treasuries benefit, so equities suffer.
10-Year US Treasury Yield

Source: Bloomberg
Losses on Wall Street overnight mostly continued in Asia, with Chinese stocks still under the cosh. The China 50 CFD hit a 9-month low yesterday and was in wait-and-see mode today, posting small gains. Recent losses across China equity markets has prompted an appeal from the Peoples Bank of China for investors to remain calm, saying that the central bank will be “forward-looking, prepare relevant policies and comprehensively use all kinds of monetary policy tools.” It may have stemmed the tide, but has yet to show signs of truly shifting sentiment.
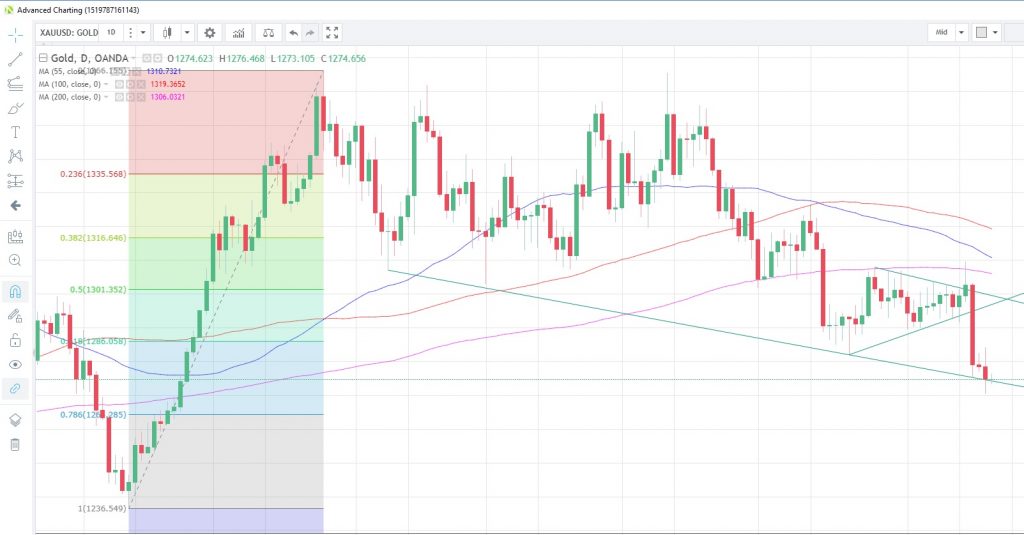
XAU/USD Daily Chart

Source: Oanda fxTrade
Dollar hits 2-year high
Demand for US Treasuries, and the necessary US dollars to fund such purchases, also pulled the dollar index to a near 2-year high in trading yesterday. The dollar’s bid tone has taken away some of gold's safe haven appeal as the precious metal slid to a 6-month low of 1,270.435 overnight. During the Asian trading session, the yellow metal managed a mild rebound to 1,274.758, consolidating the recent losses.
Aussie dollar struggles, along with gold
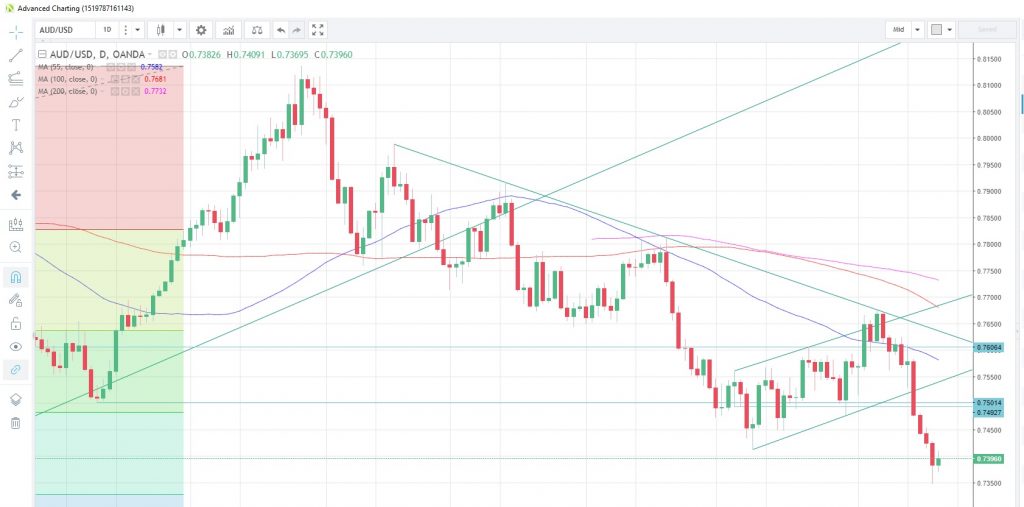
The rush towards trade protectionism is naturally affecting currencies linked to major exporting countries in the Asia region, and one of the most-hard hit is the Aussie dollar given the economy’s dependence on exports of raw materials to China. After hitting a 2-year low versus the dollar yesterday, the pair has also managed a mild rebound amid some profit-taking following a 4-day decline. The pair has regained the 0.74 handle, rising 0.32% to 0.7406. The slight uptick in prices has caused a turnaround in momentum, as measured by the stochastics indicator, though as yet the bounce has not been strong enough to confirm that a near-term base could be in place.
The rebound has been tempered somewhat by softer economic data. The Westpac leading indicator released this morning showed a 0.2% m/m decline in May following a 0.2% improvement the previous month. The indicator has been oscillating around zero since February 2017, hitting extremes on -0.2% and +0.3%
AUD/USD Daily Chart

by Andrew Robinson
